. 2025 Mar;22(2):e00529.
doi: 10.1016/j.neurot.2025.e00529. Epub 2025 Jan 31.

Quantitative imaging outperforms No-reflow in predicting functional outcomes in a translational stroke model

Affiliations

Quantitative imaging outperforms No-reflow in predicting functional outcomes in a translational stroke model

Justine Debatisse et al. Neurotherapeutics. 2025 Mar.

Abstract

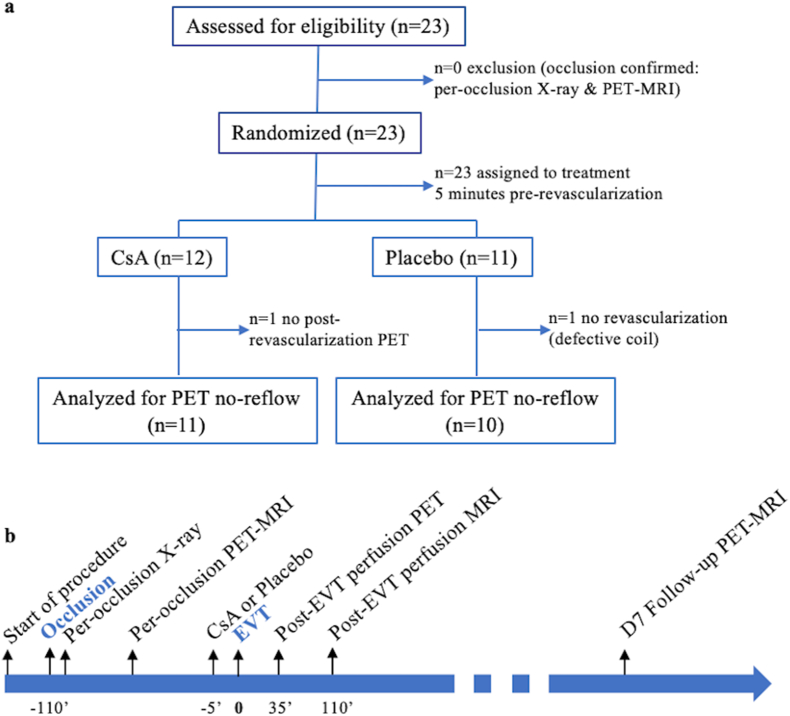
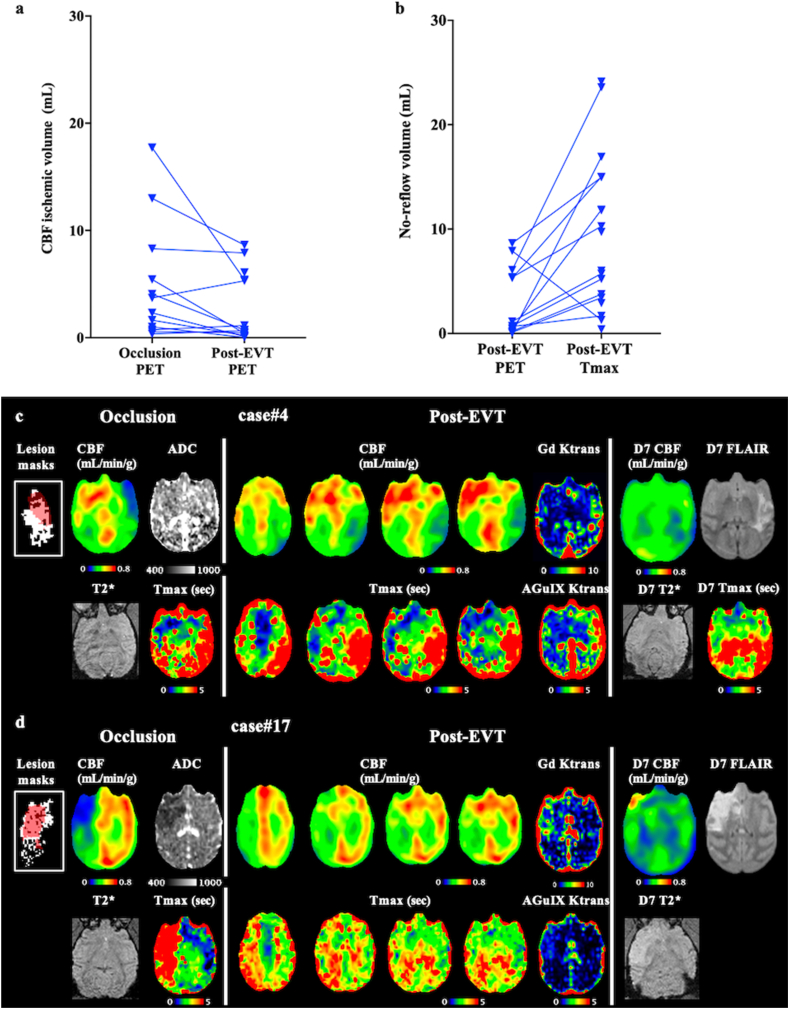
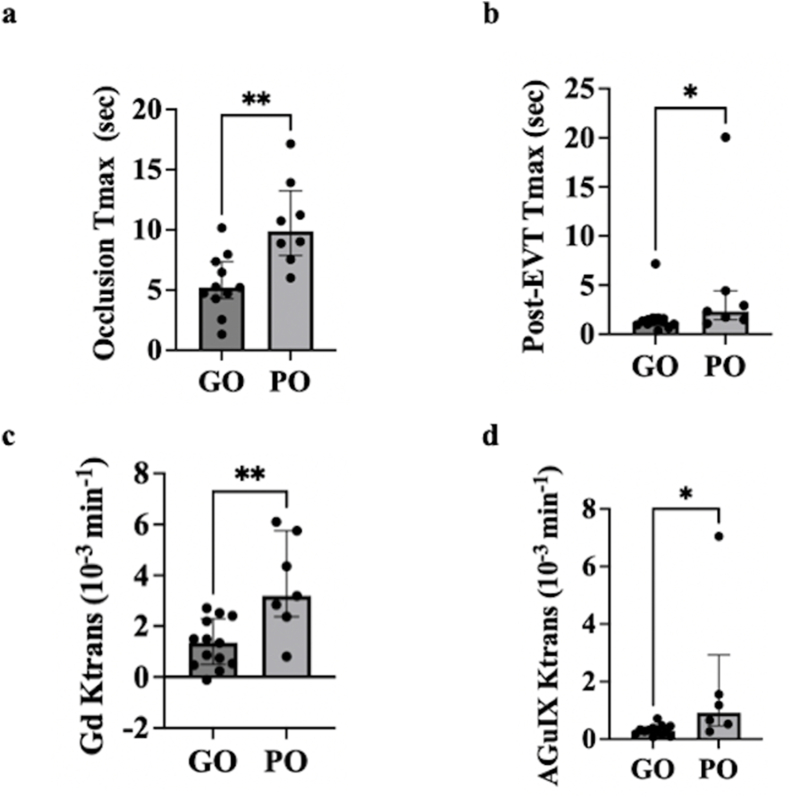
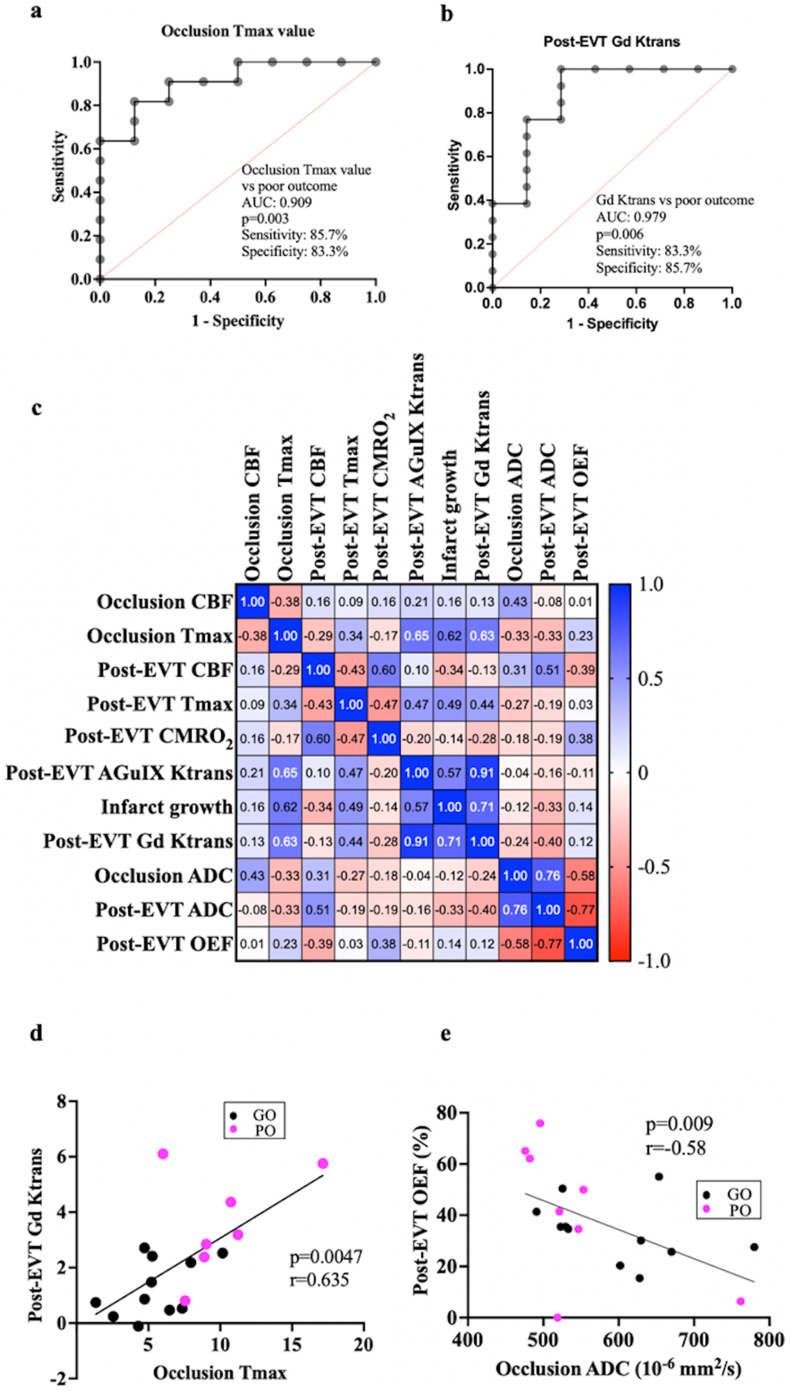
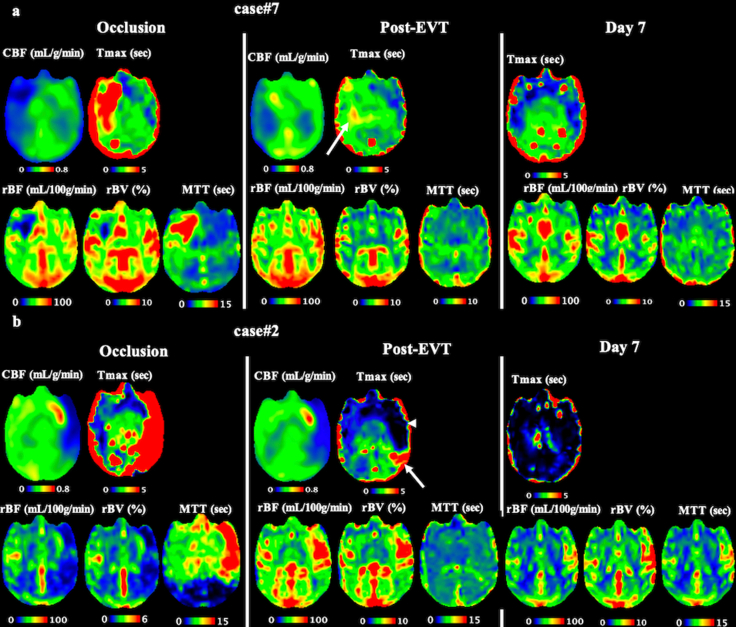
Microvascular dysfunction and no-reflow are considered a major cause of secondary damage despite revascularization in acute ischemic stroke (AIS), ultimately affecting patient outcomes. We used quantitative PET-MRI imaging to characterize early microvascular damages in a preclinical non-human primate model mimicking endovascular mechanical thrombectomy (EVT). During occlusion, PET perfusion and MRI diffusion were used to measure ischemic and lesion core volumes respectively. Following revascularization, multiparametric PET-MRI included perfusion, diffusion, blood-brain barrier (BBB) permeability MRI, and 15O-oxygen metabolism PET. Lesion growth on MRI was evaluated at one week, and the neurological score was assessed daily; a poor outcome was defined as a score>6 (0-normal, 60-death) after one week. Early after recanalization, the gold-standard PET ischemic threshold (<0.2 ​mL/min/g) identified post-EVT hypoperfusion in 67 ​% of the cases (14/21) located in the occlusion acute lesion. Acquired 110 ​min post-EVT, the area of MRI Tmax hypoperfusion was larger and even more frequent (18/20) and was also located within the acute lesion. Eight of the total cases (38 ​%) had a poor outcome, and all of them had no-reflow (7/8 MRI no-reflow and 6/8 ​PET no-reflow). Diffusion ADC alterations and post-EVT oxygen extraction fraction (OEF) values were significantly different in PET no-reflow cases compared to those without no-reflow, exhibiting an inverse correlation. Independently of no-reflow, long perfusion Tmax and post-EVT high BBB Ktrans in the lesion core were the hallmarks of poor outcome and infarct growth. This early quantitative imaging signature may predict infarct growth and poor outcome and help to identify neuroprotection targets.

Keywords: Acute ischemic stroke; Blood-brain barrier; No-reflow; Oxygen metabolism; PET-MRI; Thrombectomy.


Conflict of interest statement

Declaration of competing interest The authors declare the following financial interests/personal relationships which may be considered as potential competing interests: Canet Soulas reports financial support was provided by French National Research Agency. Lucie Chalet reports a relationship with Olea Medical that includes: employment. Timothe Boutelier reports a relationship with Olea Medical that includes: employment. If there are other authors, they declare that they have no known competing financial interests or personal relationships that could have appeared to influence the work reported in this paper.

Figures

Image 1
Graphical abstract
Fig. 1
Fig. 1
Flow chart and longitudinal PET-MRI imaging follow-up of the preclinical study (a-b). CsA ​= ​ciclosporin A; EVT ​= ​endovascular mechanical thrombectomy; MRI ​= ​magnetic resonance imaging; PET ​= ​positron emission tomography.
Fig. 2
Fig. 2
PET no-reflow volumes after revascularization (post-EVT) compared to their corresponding ischemic volumes at occlusion. (a). Post-revascularization (post-EVT) no-reflow areas were larger with MRI Tmax acquired 75 ​min after their respective PET (b). Two examples without initial PET CBF no-reflow where MRI Tmax map identifies large no-reflow (4 slices) resulting in poor outcome (c-d). Boxes (left) represent the lesion masks defined at occlusion (DWI core, white and PET ischemia, red overlay). Case#4 (initial and day 7 neuroscores:18–8) had large MRI no-reflow with blood-brain barrier (BBB) damage (high transfer rate Ktrans) for both small gadolinium (Gd, 0.5 ​kDa) and nanoparticles (AGuIX, 10 ​kDa) contrast agents (c); case #17 (initial and day 7 neuroscores: 18–60, coma and death after imaging) had large MRI no-reflow, with BBB damage (high Ktrans for the small Gd contrast agent) (d) and persistent no-reflow at day 7 (deconvolution for Tmax mapping failed due to abnormally slow kinetics).
Fig. 3
Fig. 3
Occlusion and post-revascularization (post-EVT) multiparametric quantification in poor outcome (PO) and good outcome (GO) in the DWI lesion core. At occlusion (a) and post-EVT (b), MRI Tmax were significantly longer in PO compared to GO. Blood-brain barrier damage measured by transfer rate Ktrans is significantly more pronounced in PO using both small gadolinium (Gd) and large (AGuIX nanoparticles) contrast agents (c, d).
Fig. 4
Fig. 4
Multiparametric maps at occlusion and post-revascularization as differential readouts of no-reflow cases. Post-EVT maps (4 slices) of two no-reflow cases (a-b). The white boxes (left column) represent the masks defined at occlusion, respectively DWI lesion core (white) and PET ischemia (red overlay). Both cases had large no-reflow areas on MRI Tmax (a-b, first line). Case#20 (initial neuroscore ​= ​3; day 7 neuroscore ​= ​0) showed a post-EVT preserved oxygen consumption (CMRO2) and high oxygen extraction fraction (OEF) (a), whereas case#23 (initial neuroscore ​= ​33; deceased at D1) showed profound post-recanalization perfusion (CBF PET) and CMRO2 defect and large area of suffering tissue (high OEF) (b). These features were associated with small hemorrhagic petechiae on T2∗ already present at occlusion (arrow) and marked blood-brain barrier damage (post-gadolinium enhancement on FLAIR and T1, and transfer rate Ktrans maps with high Ktrans values). Ktrans with the larger AGuIX contrast agent was not available for case#23.
Fig. 5
Fig. 5
Predictive values of parameters and their interrelationship at occlusion and after revascularization. Occlusion Tmax value in the lesion core had a good ability to predict poor outcome (AUC: 0.9, sensitivity: 86 ​%, specificity: 83 ​%) (a) as well as the post-revascularization (post-EVT) permeability measurement Ktrans using large nanoparticles AGuIX (AUC: 0.98, sensitivity: 83 ​%, specificity: 86 ​%) (b). Correlation analysis demonstrated the inter-relationship of the evaluated parameters (c) and confirmed the link between Tmax (occlusion and post-EVT), Ktrans, and infarct growth. Post-EVT, the Gd Ktrans is correlated to the perfusion Tmax measured during occlusion (d), and the oxygen extraction fraction (OEF) is inversely correlated to the apparent diffusion coefficient (ADC) measured during occlusion (e). Poor outcome (PO) cases are in magenta and good outcome (GO) cases are in black.
Figs1
Figs1
Figs2
Figs2
Figs3
Figs3

References

    1. Powers W.J., Rabinstein A.A., Ackerson T., Adeoye O.M., Bambakidis N.C., Becker K., et al. Guidelines for the early management of patients with acute ischemic stroke: 2019 update to the 2018 guidelines for the early management of acute ischemic stroke: a guideline for healthcare professionals from the American heart association/American stroke association. Stroke [Internet] 2019 https://www.ahajournals.org/doi/10.1161/STR.0000000000000211 [cited 2022 Aug 31];50:344-418. - DOI
    1. Shi Z.S., Liebeskind D.S., Xiang B., Ge S.G., Feng L., Albers G.W., et al. Predictors of functional dependence despite successful revascularization in large-vessel occlusion strokes. Stroke. 2014;45:1977–1984. - PMC - PubMed
    1. Dirnagl U., Iadecola C., Moskowitz M.A. Pathobiology of ischaemic stroke: an integrated view. Trends Neurosci. 1999;22:391–397. - PubMed
    1. Bai J., Lyden P.D. Revisiting cerebral postischemic reperfusion injury: new insights in understanding reperfusion failure, hemorrhage, and edema. Int J Stroke. 2015;10:143–152. - PubMed
    1. Fan J.L., Nogueira R.C., Brassard P., Rickards C.A., Page M., Nasr N., et al. Integrative physiological assessment of cerebral hemodynamics and metabolism in acute ischemic stroke. J Cerebr Blood Flow Metabol. 2022;42:454–470. - PMC - PubMed

MeSH terms