. 2025 Feb 1;11(1):14.
doi: 10.1038/s41540-025-00493-2.

Network analyses of brain tumor multiomic data reveal pharmacological opportunities to alter cell state transitions

Affiliations

Network analyses of brain tumor multiomic data reveal pharmacological opportunities to alter cell state transitions

Brandon Bumbaca et al. NPJ Syst Biol Appl. .

Abstract

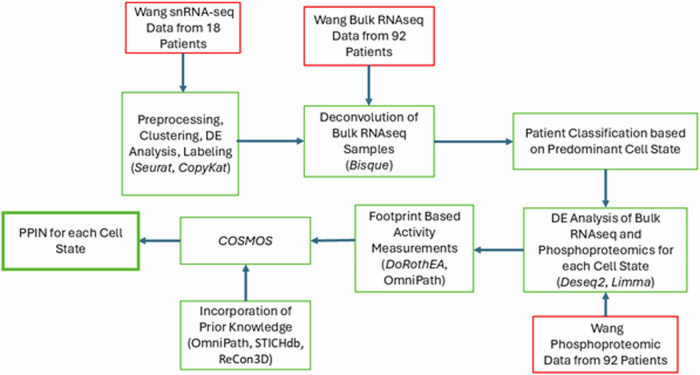
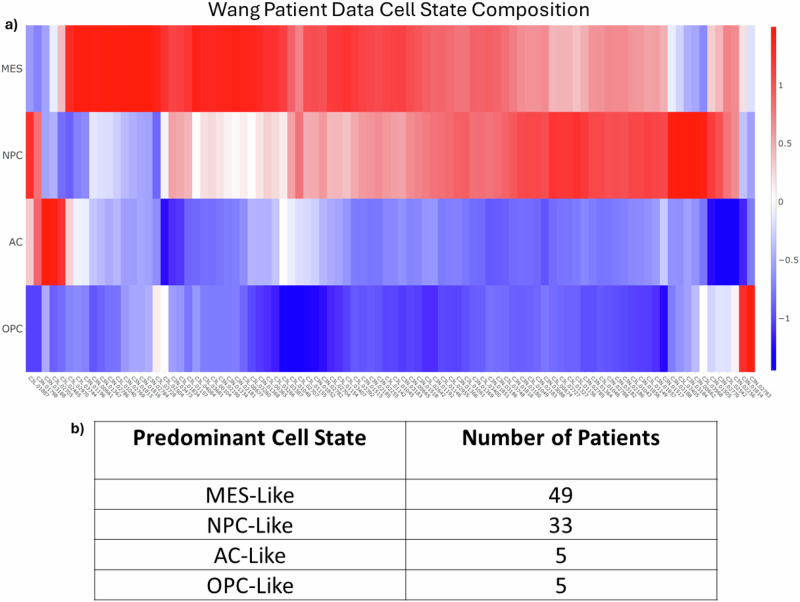
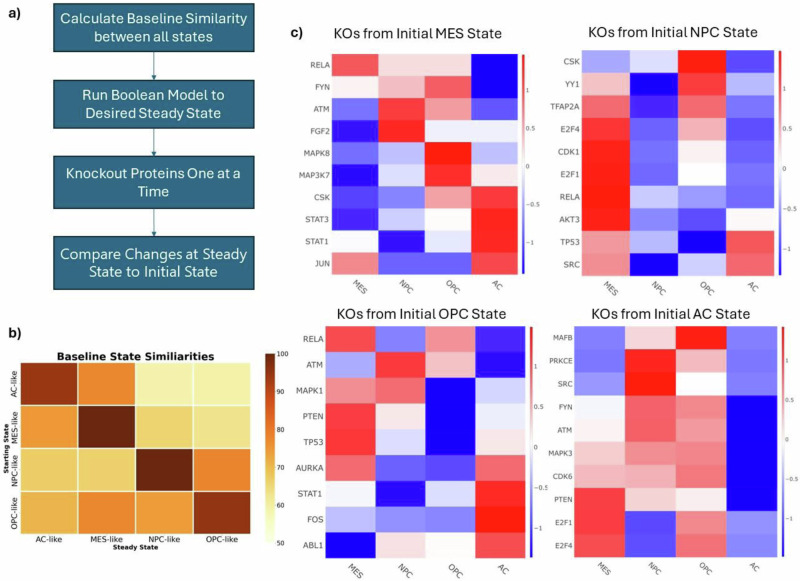
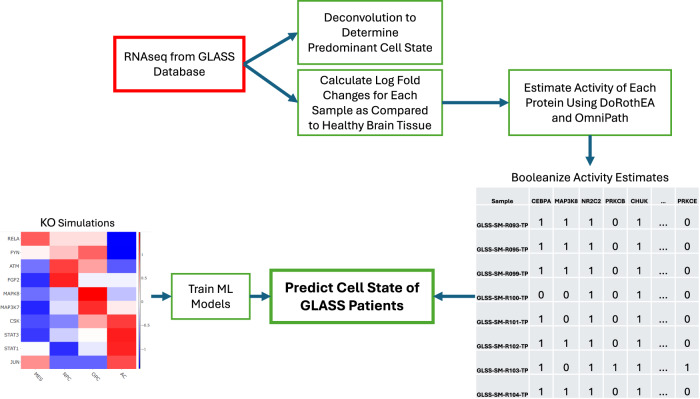
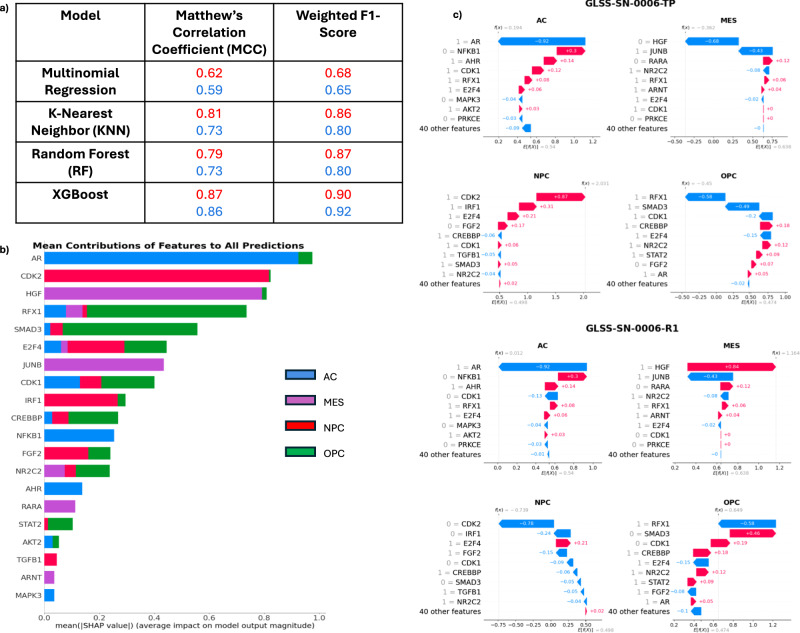
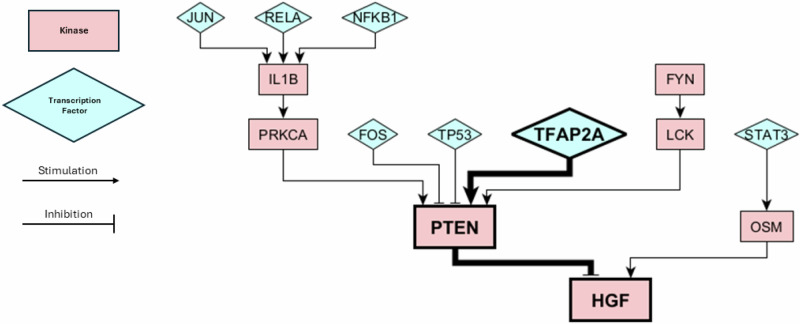
Glioblastoma Multiforme (GBM) remains a particularly difficult cancer to treat, and survival outcomes remain poor. In addition to the lack of dedicated drug discovery programs for GBM, extensive intratumor heterogeneity and epigenetic plasticity related to cell-state transitions are major roadblocks to successful drug therapy in GBM. To study these phenomenon, publicly available snRNAseq and bulk RNAseq data from patient samples were used to categorize cells from patients into four cell states (i.e., phenotypes), namely: (i) neural progenitor-like (NPC-like), (ii) oligodendrocyte progenitor-like (OPC-like), (iii) astrocyte-like (AC-like), and (iv) mesenchymal-like (MES-like). Patients were subsequently grouped into subpopulations based on which cell-state was the most dominant in their respective tumor. By incorporating phosphoproteomic measurements from the same patients, a protein-protein interaction network (PPIN) was constructed for each cell state. These four-cell state PPINs were pooled to form a single Boolean network that was used for in silico protein knockout simulations to investigate mechanisms that either promote or prevent cell state transitions. Simulation results were input into a boosted tree machine learning model which predicted the cell states or phenotypes of GBM patients from an independent public data source, the Glioma Longitudinal Analysis (GLASS) Consortium. Combining the simulation results and the machine learning predictions, we generated hypotheses for clinically relevant causal mechanisms of cell state transitions. For example, the transcription factor TFAP2A can be seen to promote a transition from the NPC-like to the MES-like state. Such protein nodes and the associated signaling pathways provide potential drug targets that can be further tested in vitro and support cell state-directed (CSD) therapy.


Conflict of interest statement

Competing interests: The authors declare no competing interests.

Figures

Fig. 1
Fig. 1. Workflow for the creation of PPINs.
All omics data (red box) were accessed via the CPTAC portal (https://proteomics.cancer.gov/data-portal) and originally published by Wang et al.. The software used in each step (packages/databases) are noted in each green box in parentheses. Seurat v4, CopyKat, Bisque, limma, and Deseq2, were used for snRNA-seq analysis, deconvolution, phosphoproteomic analysis, and bulk RNAseq analysis, respectively. Activity inferences for transcription factors and kinases were estimated using DoRothEA, OmniPath, and DecoupleR, while prior knowledge was combined from three databases (STICHdb, ReCon3D, and OmniPath).
Fig. 2
Fig. 2. Bisque Deconvolution.
a The deconvolution results of the bulk RNAseq data from Wang. Rows are the four cell states and columns are the patient IDs (as used in Wang). Patients were subsequently binned into four groups based on the predominant cell state. b The total number of patients binned into each of the four cell states.
Fig. 3
Fig. 3. Boolean Simulations.
a Workflow for the Boolean Simulations. b The similarity between each cell state at steady-state. Similarity is defined as the percentage of nodes in the same “ON” or “OFF” state at steady-state compared to its initial state in the Boolean network. c Z-normalized Hamming Distances of selected knockout simulations conducted with the Boolean Network. Positive scores (red) indicate a knockout shifted the network toward that cell state, while negative scores (blue) indicate a shift away from a cell state. Each row represents an individual protein KO, and each column describes the changes with respect to each cell state. Each heatmap represents the results from starting from each of the cell states. Starting at the top left and going clockwise: MES, NPC, OPC, AC.
Fig. 4
Fig. 4. Machine Learning Workflow.
Protein KO simulations are used to train machine learning models to predict cell state. RNAseq data from the GLASS database were used to determine the predominant cell state for each GLASS sample. These data were compared to healthy brain tissue to determine differentially expressed genes and estimate protein activity. These protein activities are booleanized to match the format of the Boolean simulations and become the test cases for machine learning performance.
Fig. 5
Fig. 5. Machine Learning Results.
a Performance of Difference ML Models. The table shows the performance of each of the four machine learning models built for classification as scored by Matthew’s Correlation Coefficient (MCC) and by the weighted F-1 Score. Red scores are for the primary tumor dataset, while blue scores are for the recurrent tumor dataset. b The Mean contribution of each Feature to all Cell State Predictions from XGBoost. Shapley values were calculated for each of the 201 tumors and the average score is shown here. Each row represents the individual gene (feature) contribution to each of the 4 cell states and shown as a sum. c Shapley Plots of a Primary and Recurrent Tumor of One Patient. Each primary and recurrent (22 months later) tumor has four Shapley plots, one for each of the four cell states. Each plot depicts how the most critical proteins affect the prediction of each cell state from the machine learning model. For this patient, the primary tumor was correctly identified as an NPC-like tumor (2nd row, left) with CDK2 the most contributing positive feature, while the recurrent tumor was correctly identified as an MES-like tumor (3rd row, right) with HGF the most contributing positive feature.
Fig. 6
Fig. 6. Submodule of our Boolean Network.
The bolded proteins show the pathway involved in causing a cell-state transition from NPC to MES, as predicted by our knockout simulations and XGBoost predictions. Kinases are depicted by pink rectangles and transcription factors are depicted as blue triangles. Activating/stimulating interactions are depicted by arrows and inactivating/inhibitory interactions are depicted with T-bars.

Update of

Similar articles

References

    1. Holland, E. C. Glioblastoma multiforme: the terminator. Proc. Natl Acad Sci USA97, 6242–6244 (2000). - PMC - PubMed
    1. Stupp, R. et al. High-grade malignant glioma: ESMO Clinical Practice Guidelines for diagnosis, treatment and follow-up. Ann. Oncol.21, v190–v193 (2010). - PubMed
    1. Kim, M. M., Umemura, Y. & Leung, D. Bevacizumab and Glioblastoma: past, present, and future directions. Cancer J.24, 180–186 (2018). - PubMed
    1. Chakravarti, A. et al. RTOG 0211: a phase 1/2 study of radiation therapy with concurrent gefitinib for newly diagnosed glioblastoma patients. Int. J. Radiat. Oncol. Biol. Phys.85, 1206–1211 (2013). - PMC - PubMed
    1. Gallego, O. et al. Efficacy of erlotinib in patients with relapsed gliobastoma multiforme who expressed EGFRVIII and PTEN determined by immunohistochemistry. J. Neurooncol.116, 413–419 (2014). - PMC - PubMed