. 2025 Feb 1;16(1):1253.
doi: 10.1038/s41467-025-56383-y.

miR-142 deficit in T cells during blast crisis promotes chronic myeloid leukemia immune escape

Affiliations

miR-142 deficit in T cells during blast crisis promotes chronic myeloid leukemia immune escape

Fang Chen et al. Nat Commun. .

Abstract

We reported that an acquired miR-142 deficit transforms chronic phase (CP) chronic myeloid leukemia (CML) leukemic stem cells (LSCs) into blast crisis (BC) LSCs. Given the role of miR-142 in the development and activity of the immune system, we postulated that this deficit also promotes LSC immune escape. Herein, we report on IL-6-driven miR-142 deficit occurring in T cells during BC transformation. In CML murine models, miR-142 deficit impairs thymic differentiation of lymphoid-primed multipotent progenitors (LMPP) into T cells and prevents T cells' metabolic reprogramming, thereby leading to loss of T cells and leukemia immune escape. Correcting miR-142 deficit with a miR-142 mimic compound (M-miR-142), alone or in combination with immune checkpoint antibodies, restores T cell number and immune activity, leading to LSC elimination and prolonged survival of BC CML murine and patient-derived xenograft models. These observations may open new therapeutic opportunities for BC CML and other myeloid malignancies.


Conflict of interest statement

Competing interests: The authors declare no competing interests.

Figures
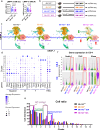
Fig. 1
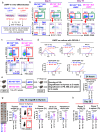
Fig. 1. Single cell RNA-seq analysis of LMPPs derived from Mir142+/+, Mir142−/−, Mir142+/+BCR-ABL, and Mir142−/−BCR-ABL mice.
a Frequency and number of LMPPs derived from BM of Mir142+/+BCR-ABL mice and Mir142−/−BCR-ABL mice (BCR-ABL were induced by tet-off for 3 weeks; n = 12 mice per group). bf Schematic design and results. BM LMPP cells were sorted from Mir142+/+, Mir142−/−, Mir142+/+BCR-ABL, and Mir142−/−BCR-ABL mice and subjected to scRNA-seq (b). Fourteen clusters (C) including T-primed, Myeloid-primed, and B/T-primed clusters were identified (c) and expression levels of hematopoietic gene transcription factors and cluster differentiation (CD) antigens in different clusters are shown (d). Distribution of each cluster in LMPPs (e) and expression levels of Notch1, Dntt, and Elane genes in lymphoid-primed C0-3 and myeloid-primed C4 (f) are shown. B/A BCR-ABL, LMPP lymphoid-primed multipotent progenitors, tet tetracycline. For a comparison between groups was performed by two-tailed, unpaired t-test. Results shown represent mean ± SEM. Source data are provided as a Source Data file.
Fig. 2
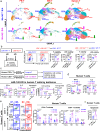
Fig. 2. MiR-142 deficit redirects LMPPs toward myeloid lineage and impairs T lymphoid differentiation.
ad. Schematic design and results. BM LMPPs from Mir142+/+BCR-ABL and Mir142−/−BCR-ABL mice (BCR-ABL were induced by tet-off for 3 weeks) were co-cultured in vitro with OP9-DL1 cells for 19 days and B, Myeloid and T cell differentiation was analyzed on day 6, 10, 15 and 19 days (a). Representative plots of B (CD19+) and myeloid (CD11b+) lineage differentiation and T cell differentiation, i.e., CD4 and CD8 DN cells, on day 6 and day 19 (b), and CD4 and CD8 DP and SP cells on day 19 (c), and combined results showing percentages of CD11b+ myeloid cells, DN4, DP, and CD3+CD4+ and CD3+CD8+ mature T cells in LMPP-derived cells after co-culture with OP9-DL1 for 6, 10, 15 and 19 days (d), analyzed by flow cytometry. The experiments were repeated three times with similar results. eh Experimental design and results. CD45.2 Mir142+/+BCR-ABL or Mir142−/−BCR-ABL LMPPs (30,000/mouse for homing experiment, 5,000/mouse for engraftment assessment) were transplanted into congenic CD45.1 normal wt recipients (e; n = 10 mice per group; mouse images created in BioRender. Chen, F. (2025) https://BioRender.com/e61c469). Numbers of LMPPs homing to thymus were measured at 24 h post injection by flow cytometry (f; n = 4 mice per group). On day 14 after LMPP transplantation, thymus was collected from the recipient mice and donor cell engraftment (n = 7 mice per group), cell cycling (n = 6 mice per group), and apoptosis (n = 7 mice per group) were measured by flow cytometry (g). On day 28, percentages of donor LMPP-derived T cells (CD45.2+CD3+) in PB and spleen were measured by flow cytometry (h; n = 10 mice per group). B/A BCR-ABL, LMPP lymphoid-primed multipotent progenitors, wt wild-type, BM bone marrow, PB peripheral blood, DN double negative, DP double positive, SP single positive. For d and fh, comparison between groups was performed by two-tailed, unpaired t-test. Results shown represent mean ± SEM. Source data are provided as a Source Data file.
Fig. 3
Fig. 3. MiR-142 deficit impairs T cell in vitro antileukemic activity.
a PB, BM and spleen T cells from Mir142+/+BCR-ABL and Mir142−/−BCR-ABL mice (BCR-ABL were induced by tet-off for 3 weeks) were subjected to scRNA-seq. Fifteen clusters were identified and annotated into distinct T cell subsets based on expression levels of naïve, memory, effector, and regulatory T gene markers. b Schematic design of experiment and results. LSKs from Mir142−/−BCR-ABL mice were co-cultured with Mir142+/+ T (WT-T) or Mir142−/− T (homozygous KO; n = 4 samples per group; middle panel), or with WT-T or Mir142+/− T (heterozygous KO; n = 6 samples per group; right panel) cells for 3 days, then viability of T and LSK cells was determined. c Cytokine levels of IFN-γ (n = 5 samples per group) and IL-2 (n = 4 per group), apoptosis (n = 4 per group), cell cycling (n = 3 per group), and cell growth (n = 4 per group) of human T cells from healthy donors with or without miR-142 KD were shown. d Levels of IFN-γ (n = 5 samples for CP CML and n = 6 for BC CML) and IL-2 (n = 6 samples per group) production in T cell subpopulations from CP CML or BC CML patients were shown. e Representative plots (left) and combined results (right) of CD4+ (n = 7 samples per group) and CD8+ (n = 8 for CP CML; n = 7 for BC CML) subpopulations in T cells from patients with BC CML or CP CML. f Spontaneous apoptosis of T cells from CP CML or BC CML patients (n = 5 samples per group). B/A BCR-ABL, PB peripheral blood, BM bone marrow, tet tetracycline, scRNA-seq single cell RNA sequencing, CM central memory, EM effector memory, Treg regulatory T, KD knock down, CML chronic myeloid leukemia, CP chronic phase, BC blast crisis. For bf, comparison between two groups was performed by two-tailed, unpaired t-test. For b, comparisons among multi-groups were performed by one-way ANOVA and P values were corrected for multiple comparisons using Holm–Šídák method. Results shown represent mean ± SEM. Source data are provided as a Source Data file.
Fig. 4
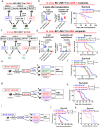
Fig. 4. MiR-142 deficit decreases T cell in vivo antileukemic activity.
a, b Experimental design and results. CD45.2 Mir142−/−BCR-ABL LSK (BC-LSK) and Mir142+/+ T (WT-T) or Mir142−/− T (KO-T) cells were co-transplanted into CD45.1 congenic recipients (lethally irradiated to eradicate host T cells; a). Donor T cell (CD45.2+ CD3+) and leukemic cell (% of CD45.2+ minus % of CD45.2+ CD3+) engraftment in PB at 4 weeks after transplantation and survival of the recipients were analyzed (n = 9 mice for BC-LSK + WT-T group; n = 11 for BC-LSK+ KO-T group; b). c, d. Experimental design and results. CD45.2 Mir142−/−BCR-ABL LSKs were co-transplanted with Mir142+/+ or Mir142+/− or Mir142−/− T cells into NSG mice (CD45.1, lacking T cells; c). Donor T cell and leukemic cell engraftment in PB at 4 weeks after transplantation and survival of the recipients were analyzed (d; n = 8 mice for BC-LSK+ WT-T group; n = 10 for BC-LSK+hom KO-T group; n = 12 for BC-LSK+het KO-T group). Experimental design and results. Mir142−/−BCR-ABL LSKs were transplanted into Mir142+/+ (n = 15), Mir142+/−(n = 13), or Mir142−/−(n = 11) recipients (e) and survival of the recipients was analyzed (f). Experimental design and results. Mir142−/−BCR-ABL LSKs were transplanted into Mir142+/+ (n = 15), Mir142−/−(n = 13), or Mir142flox(f)/fLck-cre+ (Mir142TΔ/Δ, n = 9) recipients (g) and survival of the recipients was analyzed (h). Experimental design and results. Mir142+/+BCR-ABL LSKs (CP-LSK) were transplanted into Mir142+/+ (n = 21), Mir142−/− (n = 15), or Mir142TΔ/Δ (n = 9) recipients (i) and survival of the recipients was analyzed (j). k Survival of Mir142flox(f)/fLck-cre- BCR-ABL (Mir142Twt/wt B/A, n = 14) and Mir142f/fLck-cre+ BCR-ABL (Mir142TΔ/Δ B/A, n = 7) mice. CP chronic phase, BC blast crisis, PB peripheral blood, tet tetracycline, LSK LinSca-1+c-Kit+, w week. For b, comparison between two groups was performed by two-tailed, unpaired t-test. For d, comparisons among multi-groups were performed by one-way ANOVA. For overall survival data in b, d, f, h, j and k, log-rank test was used to compare two or more survival curves. P values were corrected for multiple comparisons using Holm–Šídák method. Results shown represent mean ± SEM. For a, c, e, g and i, mouse images were created in BioRender. Chen, F. (2025) https://BioRender.com/e61c469. Source data are provided as a Source Data file.
Fig. 5
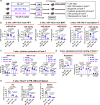
Fig. 5. T cell miR-142 deficit in BC CML is mediated by blast-secreted cytokines.
ae Experimental design and results. BM MNCs from CD45.2 normal wt, Mir142+/+BCR-ABL and Mir142−/−BCR-ABL mice were transplanted into congenic CD45.1 recipients (a; 106/mouse, n = 10 mice per group; mouse images created in BioRender. Chen, F. (2025) https://BioRender.com/e61c469). miR-142 levels in host T cells (CD45.1+ CD3+) from PB, BM and spleen of the recipients was determined by Q-RT-PCR at 2 weeks after transplantation (b; n = 10 mice for normal wt and Mir142+/+BCR-ABL groups; n = 8 for Mir142−/−BCR-ABL group). Cytokine production (c) of IFN-γ (n = 7 mice per group), TNF-α (n = 8 mice per group), and IL-2 (n = 8 mice per group) and apoptosis and cell cycling (d; n = 6 mice per group) of host T cells from the spleen of the recipients at 2 weeks after transplantation, and percentages of host T cells in PB (n = 10 mice per group), BM (n = 8 mice per group) and spleen (n = 15 mice per group) at 4 weeks after transplantation (e) were analyzed by flow cytometry. wks weeks, BM bone marrow, MNC mononuclear cells, NL WT normal wild-type, B/A BCR-ABL, tet tetracycline, PB peripheral blood. For be, comparisons among multi-groups were performed by one-way ANOVA. P values were corrected for multiple comparisons using Holm–Šídák test. Results shown represent mean ± SEM. Source data are provided as a Source Data file.
Fig. 6
Fig. 6. M-miR-142 restores T cell antileukemic activity.
a Representative plots and combined results of uptake of Cy3-conjugated M-miR-142 by human and mouse T cells (in vitro: 1μΜ; in vivo: 30 mg/kg; n = 3). be. Experimental design and results. NSG mice were co-transplanted with Mir142−/−BCR-ABL LSK+Mir142−/− T cells and then treated with SCR or M-miR-142 for 3 weeks (b), circulating T and leukemic cell counts (c), circulating blasts (%) and blood smear (d), and survival (e) were shown (n = 10 per group). fh. Experimental design and results. Mir142−/−BCR-ABL mice were treated with SCR or M-miR-142 for 3 weeks (f), then BM T cells (n = 7 per group), WBC counts (n = 8), PB LSKs (n = 5), and survival (n = 14 for SCR group; n = 13 for M-miR-142 group) were shown (g). Leukemic cell engraftment (n = 9) and survival (n = 10) of the 2nd recipients were shown (h). il Experimental design and results. Two cohorts of BC CML PDX were given autologous human T cells and then treated with SCR or M-miR-142 (30 mg/kg/day, iv) for 3 weeks (i). Human T and leukemic cell engraftment in PDX-1 (j; n = 8 for SCR and T+ SCR groups; n = 12 for M-miR-142 and T+M-miR-142 groups) and PDX-2 (k; n = 8 for SCR and M-miR-142 groups; n = 14 for T+ SCR and T+M-miR-142 groups) and the survival of PDX-2 (k; n = 7 for SCR and M-miR-142 groups; n = 9 for T+ SCR and T+M-miR-142 groups) were shown. PB human leukemic cell engraftment and survival (l; n = 8 for SCR and M-miR-142 groups; n = 9 for T+ SCR and T+M-miR-142 groups) of the 2nd recipients receiving BM cells from the treated PDX-2 were shown. SCR scramble RNA, LSK LinSca-1+c-Kit+, PDX patient-derived xenograft. For c, d, g, h, j and k, comparison between two groups was performed by two-tailed, unpaired t-test. For jl, comparisons among multi-groups were performed by one-way ANOVA. For e, g, h, k and l, log-rank test was used to compare two or more survival curves. P values were corrected for multiple comparisons using Holm–Šídák method. Results shown represent mean ± SEM. For b, f and i, mouse images were created in BioRender. Chen, F. (2025) https://BioRender.com/e61c469. Source data are provided as a Source Data file.
Fig. 7
Fig. 7. M-miR-142 in combination with TKI and PD-1 Ab showed enhanced antileukemic activity in BC CML models.
af Experimental design and results. A cohort of BC CML mice were treated with NIL (30 mg/kg/day, oral gavage), NIL+M-miR-142(30 mg/kg/day, iv), NIL+PD-1 Ab (10 mg/kg, 3x/week), NIL+M-miR-142+PD-1 Ab, or vehicle for 3 weeks (a; n = 15 per group). WBC counts (b), blood smear (c), leukemic cell engraftment and host T cell percentages in PB (d), and survival of the treated mice (e) are shown. BM cells from the treated mice were transplanted into 2nd recipients (n = 15 for vehicle and NIL groups and n = 10 for the remaining three groups). Leukemic cell engraftment in PB and survival of the 2nd recipients (f) are shown. gj Experimental design and results. A cohort of BC CML PDX mice were given autologous human T cells (106/mouse on day 14) and 3 weeks’ treatment with vehicle, NIL (30 mg/kg/day, oral gavage), NIL+M-miR-142(30 mg/kg/day, iv), NIL+PD-1 Ab (10 mg/kg, 3x/week), or NIL+M-miR-142+PD-1 Ab (g). Blood smear (h), human (h) leukemic cell engraftment in PB (i, left; % of hCD45+ minus % of hCD3+; n = 8 for vehicle and NIL groups; n = 9 for NIL+M-miR-142 and NIL+PD-1 Ab groups; n = 10 for NIL+M-miR-142+PD-1 Ab group) and survival (i, right; n = 11 for vehicle group; n = 13 for NIL group; n = 14 for NIL+M-miR-142 and NIL+PD-1 Ab groups; n = 15 for NIL + M-miR-142 + PD-1 Ab group) were monitored. BM cells from the treated mice were transplanted into 2nd NSGS recipient mice (n = 10 per group). Human cell engraftment in PB and survival of the 2nd recipients are shown (j). TKI tyrosine kinase inhibitor, Ab antibody, BC blast crisis, CML chronic myeloid leukemia, NIL nilotinib, WBC white blood cell, PB peripheral blood, 2nd: secondary; PDX: patient-derived xenograft. For b, d, f, i and j, comparisons among multi-groups were performed by one-way ANOVA. For e, f, i and j, log-rank test was used to compare survival curves among multi-groups. P values were corrected for multiple comparisons using Holm–Šídák method. Results shown represent mean ± SEM. For a and g, mouse images were created in BioRender. Chen, F. (2025) https://BioRender.com/e61c469. Source data are provided as a Source Data file.

References

    1. Rowley, J. D. Letter: a new consistent chromosomal abnormality in chronic myelogenous leukaemia identified by quinacrine fluorescence and Giemsa staining. Nature243, 290–293 (1973). - PubMed
    1. Shrestha, A. et al. MicroRNA-142 is a multifaceted regulator in organogenesis, homeostasis, and disease. Dev. Dyn.246, 285–290 (2017). - PubMed
    1. Sharma, S. Immunomodulation: a definitive role of microRNA-142. Dev. Comp. Immunol.77, 150–156 (2017). - PubMed
    1. Kramer, N. J. et al. Altered lymphopoiesis and immunodeficiency in miR-142 null mice. Blood125, 3720–3730 (2015). - PubMed
    1. Sun, Y. et al. miR-142 controls metabolic reprogramming that regulates dendritic cell activation. J. Clin. Invest.129, 2029–2042 (2019). - PMC - PubMed

MeSH terms