. 2025 Feb 1;16(1):1262.
doi: 10.1038/s41467-025-56547-w.

Vaccine-induced T cell receptor T cell therapy targeting a glioblastoma stemness antigen

Affiliations

Vaccine-induced T cell receptor T cell therapy targeting a glioblastoma stemness antigen

Yu-Chan Chih et al. Nat Commun. .

Abstract

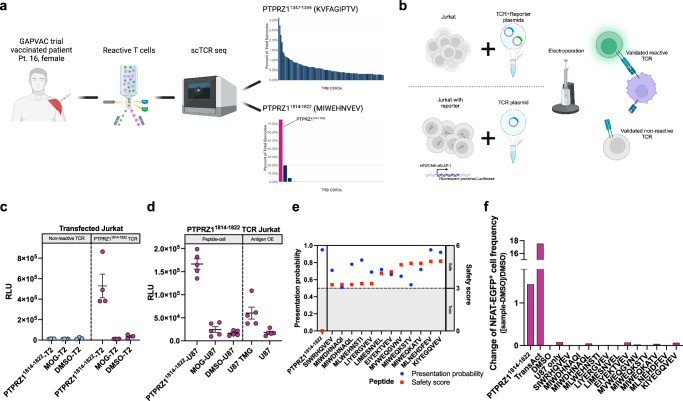
T cell receptor-engineered T cells (TCR-T) could be advantageous in glioblastoma by allowing safe and ubiquitous targeting of the glioblastoma-derived peptidome. Protein tyrosine phosphatase receptor type Z1 (PTPRZ1), is a clinically targetable glioblastoma antigen associated with glioblastoma cell stemness. Here, we identify a therapeutic HLA-A*02-restricted PTPRZ1-reactive TCR retrieved from a vaccinated glioblastoma patient. Single-cell sequencing of primary brain tumors shows PTPRZ1 overexpression in malignant cells, especially in glioblastoma stem cells (GSCs) and astrocyte-like cells. The validated vaccine-induced TCR recognizes the endogenously processed antigen without off-target cross-reactivity. PTPRZ1-specific TCR-T (PTPRZ1-TCR-T) kill target cells antigen-specifically, and in murine experimental brain tumors, their combined intravenous and intracerebroventricular administration is efficacious. PTPRZ1-TCR-T maintain stem cell memory phenotype in vitro and in vivo and lyse all examined HLA-A*02+ primary glioblastoma cell lines with a preference for GSCs and astrocyte-like cells. In summary, we demonstrate the proof of principle to employ TCR-T to treat glioblastoma.


Conflict of interest statement

Competing interests: The identified reactive TCR was patented by Y-C.C., M.K., C.K., E.W.G., W.W., M.P. and L.B., “T cell receptor derived binding polypeptides” (WO 2023/213904). E.W.G. and M.P. are founders of TCellTech. The remaining authors declare no competing interests.

Figures

Fig. 1
Fig. 1. PTPRZ1 is upregulated in glioblastoma, particularly in GSCs and AC-like glioblastoma.
a PTPRZ1 expression in primary tumor compared to adjacent normal tissues in TCGA-glioblastoma (TCGA-GB) dataset with two-tailed t-test. b PTPRZ1 expression in single cells of glioblastoma from previously published dataset. Cell type annotation is shown in Supplementary Fig. 1d. c UMAP of scRNA-sequenced glioma and glioblastoma samples from Supplementary Fig. 1i with cell type annotation. d Gene expression of PTPRZ1 for c. More cell type-defining genes are shown in Supplementary Fig. 1j. e, f Protein expression of PTPRZ1 and GFAP from 20 primary and 20 recurrent glioblastoma matched samples. Each dot is the average of all tumor pieces of a patient. g Correlation of PTPRZ1+ and GFAP+ cell frequencies. Each dot represents a tumor piece. h Untargeted ligandomics of primary glioblastoma cell lines with overlapping of PTPRZ1 ligands across primary glioblastoma cell lines. The highlighted overlapped peptide is PTPRZ11814-1822. i, j Cellular states of cancer cells in c and PTPRZ1 expression. k, l PTPRZ1 expression across distinct cellular states and its correlation with GSC score in cancer cells from c. k was analyzed with one-way ANOVA multiple comparison corrected with Holm-Šidák method. g and l were analyzed with Spearman correlation.
Fig. 2
Fig. 2. A PTPRZ1-reactive TCR was identified from a vaccinated glioblastoma patient.
a Schematic workflow depicting the sorting and sequencing of PTPRZ1-reactive T cells with CDR3 frequency plots showing dominant TCRs. The later identified reactive TCR is highlighted. b Validation of dominant TCR clonotypes from a using Jurkat cells transfected with a TCR and a reporter plasmid (top) or Jurkat reporter cells transfected with a TCR plasmid (bottom). c Luminescence reporter signal of TCR-Jurkat cells upon overnight coculture with peptide-loaded T2 target cells. Each dot represents a technical replicate, n(PTPRZ11814-1822-T2) = 4, n(MOG-T2) = 4, and n(DMSO-T2) = 3 d Luminescence reporter signal following overnight coculture with peptide-loaded or antigen-expressing target cells. Each dot represents a technical replicate, n = 5. e in silico AI-predicted off-targets of the identified PTPRZ1-reactive TCR with presentation probability indicated in blue circles and safety score indicated in red squares. Presentation probability predicts whether the peptide is presented on MHC, and lower safety score denotes a higher likelihood of cross-reactivity. f Fluorescence reporter signal of TCR-Jurkat cells upon overnight coculture with various peptide-loaded target cells. Data are presented as mean values ± SEM. Created in BioRender. D170, P. (2025) https://BioRender.com/z55e945 (a); https://BioRender.com/k87g100 (b).
Fig. 3
Fig. 3. PTPRZ11814-1822 TCR-T product was persistent, TSCM-abundant, and efficient in target cell killing.
a TCR expression on primary human T cells over 3-week period. b Percentage of CD4+ and CD8+ T cells in TCR-T cell products over 3 weeks. c CD8+ T cell subsets on the day of PBMC isolation and after transduction with longitudinal monitoring on the right. N(biological)=4. d Percentage of surface activation marker-positive, CD137+, cells in CD8+ TCR-T cells upon 24 h coculture with target cells. e Percentage of effector protein-positive, Granzyme B+, cells in CD8+ TCR-T cells upon 24 h coculture with target cells. f Detection of LDH released into the medium after 24 h coculture of TCR-T cells and target cells. g Titration of E:T ratio with TCR-T cells and U87 TMG target cells, measured with LDH release. 1 unit is 75 ×103 cells. Specific OD is ODPTPRZ1-ODFlu. dg were performed with biological replicates N = 3. h Schematic of isolating CD4+ and CD8+ TCR-T cells with MACS and subjecting them to various cocultures. i Cytotoxicity upon serial diluting CD4+ T cells. j Cytotoxicity upon serial diluting CD8+ T cells. i and j were measured with LDH release, and 1 unit equals to 75 ×103 cells in. k Cytotoxicity of coculture using reactive CD8+ T cells with the target cell and either reactive or non-reactive CD4+ T cells, measured with cell counting through flow cytometry. df were analyzed with two-way ANOVA multiple comparison corrected with Holm–Šidák method. k was analyzed with two-tailed paired t-test. Data are presented as mean values ± SEM. Created in BioRender. D170, P. (2025) https://BioRender.com/p23d083 (h).
Fig. 4
Fig. 4. Intravenous and intracerebroventricular delivery of PTPRZ1-TCR-T is efficacious in experimental flank and brain tumors.
a Workflow of i.v. ACT on s.c. tumor model. b Longitudinal s.c. tumor growth monitoring. c Workflow of i.v. and i.cv. ACT on i.c. tumor model. d i.c. tumor imaging with preclinical MRI. e Longitudinal monitoring of i.c. tumor size with MRI and assessment of radiographic response upon ACT treatment. f Overall survival of i.c. tumor-bearing mice treated with i.v. and i.cv. ACT. g T cell engraftment validation with cheek blood after ACT, measured with cell counting through flow cytometry. N(Tumor only)=4, N(Flu TCR-T cell)=8, and N(PTPRZ118141-1822 TCR-T cell)=7. h Exemplary contour plot of CD8+ TCR-T cell subsets of transferred T cells in host blood. i Percentages of different CD8+ T cell subsets of transferred T cells in host blood. Same numbers of replicates were used from g. j Immunofluorescent staining of grafted i.c. tumor cells, MHC I+, and transferred T cells, CD3+ MHC I+. k Transferred T cell numbers in tumoral and non-tumoral tissues in j upon ACT treatment. For Flu TCR-T cell group, N = 6 in both tumor and non-tumor tissues. For PTPRZ11814-1822 TCR-T cell group, N = 6 in the tumor tissue, and N = 7 in the non-tumor tissue. l RNAscopeTM identifying TMG expression in i.c. tumors. m H score analysis of TMG expression in l. N(Flu TCR-T cell)=6 and N(PTPRZ11814-1822 TCR-T cell)=5. b and e were analyzed with nonlinear regression, exponential growth equation to conclude if one curve fits all compared curves. f was analyzed with Log-rank test. g and k were analyzed with one-way and two-way ANOVA multiple comparison, respectively, corrected with Holm-Šidák method. m was analyzed with nonparametric t-test. All replicates here are biological. Data are presented as mean values ± SEM. Created in BioRender. D170, P. (2025) https://BioRender.com/b68u538 (a); https://BioRender.com/o44l987 (c).
Fig. 5
Fig. 5. PTPRZ11814-1822 TCR-T cells broadly lyse HLA-A*02+ primary glioblastoma cells, particularly stem-like SCCs.
a Cytotoxicity measured with LDH release of primary cell line upon coculture with TCR-T cells. N(biological)=3. b Experimental design to assess preferential killing of TCR-T cells on dye-retaining SCCs or dye-losing FCCs. c Assessment of specific lysis of SCCs and FCCs upon short-term, 5 h, or long-term, 24 h, coculture with TCR-T cells, measured with cell counting by flow cytometry. d HLA-A2 typing of established glioblastoma primary cell lines. e Assessment of specific lysis by PTPRZ11814-1822 TCR-T cells normalized to Flu TCR-T cell-treated HLA-A*02+ or HLA-A*02- tumors. f and g Activation of CD8+ TCR-T cells after 24 h coculture with various glioblastoma primary cell lines that are HLA-A*02+ or HLA-A*02-. h Activation of CD4+ TCR-T cells after 24 h coculture with glioblastoma primary cell lines. i PTPRZ1 expression levels in parental and CRISPR PTPRZ1 KO D170_44 cell lines measured with RT-qPCR. The expression levels were normalized to the parental line, and two qPCR targets were assessed for two different coding sequences (CDS) of PTPRZ1. n(technical)=3. j Assessment of specific lysis of cell lines as in i by PTPRZ11814-1822 TCR-T cells normalized to Flu TCR-T cell-treated samples. In c, eh, and j, N(biological)=4. All analyses were performed with two-way ANOVA multiple comparison corrected with Holm-Šidák method. Blue, Flu TCR-T control cells; purple, PTPRZ11814-1822 TCR-T cells in a, c, eh, j). Data are presented as mean values ± SEM. Created in BioRender. D170, P. (2025) https://BioRender.com/z72g103 (b).
Fig. 6
Fig. 6. IPTOs reveal predominant targeting of AC-like cells and GSCs by PTPRZ11814-1822 TCR-T cells.
a IPTO generation from three HLA-A*02+ glioblastoma samples and treatment with TCR-T cells. b UMAP of malignant cells and immune cells derived from Supplementary Fig. 11a with their marker expression on the right. More canonical markers are visualized in Supplementary Fig. 11b. c Frequency of cell content in IPTOs upon TCR-T cell treatment. d PTPRZ1 expression after TCR-T cell treatment. e Cellular states of generated IPTOs with PTPRZ1 expression. f and g AC-like module score and frequency of distinct cellular states after ACT. h and i Correlation of PTPRZ1 expression and GSC module score in malignant cells in IPTOs and frequency of GSC upon TCR-T cell treatment. Cells score over 0.15 GSC module score are defined as GSCs. d and f were analyzed with one-way ANOVA multiple comparison corrected with Holm-Šidák method. c, g and i were analyzed with two-sided Fisher’s exact test. h was analyzed with spearman correlation. Created in BioRender. D170, P. (2025) https://BioRender.com/k21a580 (a).

References

    1. Hirayama, A. V. et al. High rate of durable complete remission in follicular lymphoma after CD19 CAR-T cell immunotherapy. Blood134, 636–640 (2019). - PMC - PubMed
    1. Schuster, S. J. et al. Long-term clinical outcomes of tisagenlecleucel in patients with relapsed or refractory aggressive B-cell lymphomas (JULIET): a multicentre, open-label, single-arm, phase 2 study. Lancet Oncol.22, 1403–1415 (2021). - PubMed
    1. Cappell, K. M. & Kochenderfer, J. N. Long-term outcomes following CAR T cell therapy: what we know so far. Nat. Rev. Clin. Oncol.20, 359–371 (2023). - PMC - PubMed
    1. Albelda, S. M. CAR T cell therapy for patients with solid tumours: key lessons to learn and unlearn. Nat. Rev. Clin. Oncol.21, 47–66 (2024). - PubMed
    1. Bausart, M., Preat, V. & Malfanti, A. Immunotherapy for glioblastoma: the promise of combination strategies. J. Exp. Clin. Cancer Res.41, 35 (2022). - PMC - PubMed

MeSH terms