. 2025 Feb 1;16(1):1259.
doi: 10.1038/s41467-025-56515-4.

Effective in vivo binding energy landscape illustrates kinetic stability of RBPJ-DNA binding

Affiliations

Effective in vivo binding energy landscape illustrates kinetic stability of RBPJ-DNA binding

Duyen Huynh et al. Nat Commun. .

Abstract

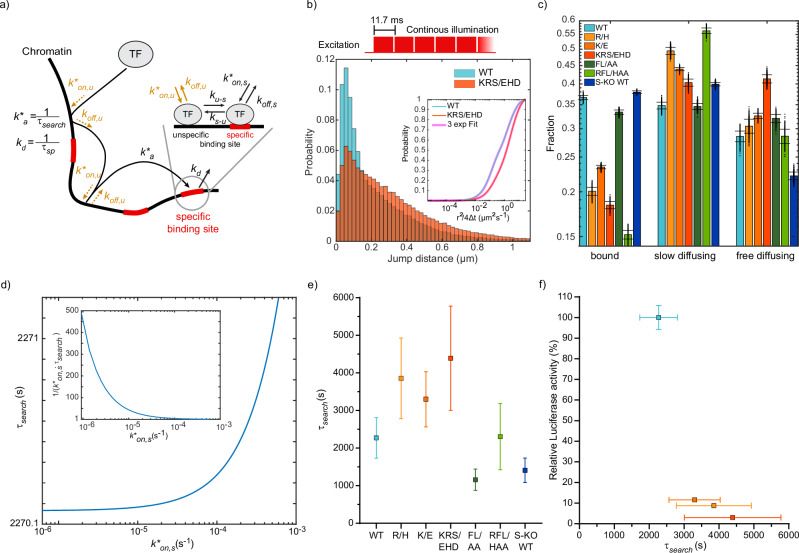
Transcription factors (TFs) such as RBPJ in Notch signaling bind to specific DNA sequences to regulate transcription. How TF-DNA binding kinetics and cofactor interactions modulate gene regulation is mostly unknown. We determine the binding kinetics, transcriptional activity, and genome-wide chromatin occupation of RBPJ and mutant variants by live-cell single-molecule tracking, reporter assays, and ChIP-Seq. Importantly, the search time of RBPJ exceeds its residence time, indicating kinetic rather than thermodynamic binding stability. Impaired RBPJ-DNA binding as in Adams-Oliver-Syndrome affect both target site association and dissociation, while impaired cofactor binding mainly alters association and unspecific binding. Moreover, our data point to the possibility that cofactor binding contributes to target site specificity. Findings for other TFs comparable to RBPJ indicate that kinetic rather than thermodynamic DNA binding stability might prevail in vivo. We propose an effective in vivo binding energy landscape of TF-DNA interactions as instructive visualization of binding kinetics and mutation-induced changes.


Conflict of interest statement

Competing interests: The authors declare no competing interests.

Figures

Fig. 1
Fig. 1. Interactions of RBPJ with cofactors and DNA determine transactivation activity and binding specificity.
a Surface representation of a RBPJ-SHARP complex structure (light gray/blue) bound to DNA (dark gray) (PDB entry: 6DKS). Amino acid mutations in interfaces of cofactor binding (green) and DNA-binding (orange) are highlighted. In vivo luciferase activity assays. Relative luciferase activity of RBPJ-specific reporter constructs in RBPJ knockout cell line transfected with b RBPJ-VP16 fusion variants or c RBPJ variants and co-transfected with NICD (mean values ± s.d.; n = 4 independent experiments). P-values were determined using two-tailed, unpaired Student’s t-test. Insets: Scheme of the reporter constructs and activating moieties. For details of variants see explanation in the text. -RBPJ: control with untransfected RBPJ knockout cell line, −/+NICD: control with untransfected/NICD-transfected RBPJ knockout cell line. d Heatmap of ChIP-seq reads from RBPJ knockout cell line transduced with HT-RBPJ variants with reads centered around RBPJ binding sites called in an untransduced HeLa cell line control. ChIP was performed with an antibody against RBPJ. Read number is color-coded. For details of variants see the explanation in the text. S-KO: ChIP-seq reads from SHARP knockout cell line transfected with HT-RBPJ. e Number of binding sites called for HT-RBPJ variants in RBPJ knockout cell line or SHARP knockout cell line. f, g Venn diagrams depicting common binding sites of indicated HT-RBPJ variants. Color code for RBPJ variants in b, c, eg: RBPJ WT: light blue, R/H: yellow, K/E: orange, KRS/EHD: red, FL/AA: dark green, RFL/HAA: light green, S-KO RBPJ-WT: dark blue. Source Data are provided as a Source Data file for Fig. 1b, c, e.
Fig. 2
Fig. 2. Residence times of HT-RBPJ variants.
a Scheme of illumination patterns in time-lapse measurements with indicated camera integration and frame cycle times. b Tracks of single HT-RBPJ-WT molecules overlaid with an example image of a 100 ms time-lapse movie (Supplementary Movie 1) and kymographs of indicated molecules. Scale bar is 4 µm. c Survival time distributions of HT-RBPJ-WT (light blue lines) and HT-RBPJ-KRS/EHD mutant (orange lines) at time-lapse conditions shown on top and survival time function obtained with GRID (black lines). For experimental statistics see Supplementary Table 3. d State spectra of dissociation rates of HT-RBPJ-WT and HT-RBPJ-KRS/EHD obtained with GRID using all data (red). As an error estimation GRID was run 500 times with each run using 80 % of the data (black circles). The blue line indicates the dissociation rate of 0.01 s−1. For experimental statistics see Supplementary Table 3. e Specific residence times of HT-RBPJ WT and the DNA triple mutant KRS/EHD in Hela RBPJ knock-out cells (inverse of kd, the weighted average of dissociation rates in d) below 0.01 s−1). Error bars denote s.d. from the resampled spectra in d). Statistics are provided in Supplementary Table 3. f Specific residence times of HT-RBPJ variants (inverse of kd, the weighted average of dissociation rates below 0.01 s−1) (Supplementary Table 2). Error bars denote s.d. of the resampled data. Inset: sketch of RBPJ dissociation from a specific binding site with rate constant kd. Statistics are provided in Supplementary Table 3. g Unspecific residence times of HT-RBPJ variants (inverse of koff,u, the weighted average of dissociation rates above 0.01 s−1) (Supplementary Table 2). Error bars denote s.d. of the resampled data. Inset: sketch of RBPJ dissociation from an unspecific site with rate constant koff,u. Statistics are provided in Supplementary Table 3. h) Relative luciferase activity of HT-RBPJ-VP16 fusion variants versus their specific residence time (replot of data from Figs. 1b and 2f). Color code in f, g, h as in Fig. 1. Source Data are provided as a Source Data file for Fig. 2c–h.
Fig. 3
Fig. 3. Bound fractions and target site search times of HT-RBPJ variants.
a Three-state model of the transcription factor target site search process via facilitated diffusion. Unbound transcription factors associate to a specific binding site with the overall association rate k*a combining the two pathways of direct association with rate k*on,s and of indirect association via unspecific binding with rate k*on,u close to the specific site and sliding into specific binding with the transition rate ku-s. Multiple unspecific binding events may occur before the specific site is bound. Dissociation from the specific binding site occurs with the overall dissociation rate kd combining the two pathways of direct dissociation with rate koff,s and indirect dissociation via transition to unspecific binding with rate ks-u and unspecific dissociation with rate koff,u. b Upper panel: Scheme of illumination pattern for fast tracking with indicated frame cycle time. Lower panel: jump distance distribution of HT-RBPJ-WT (blue) and HT-RBPJ-KRS/EHD (orange). Inset: cumulative jump distance distributions with three-component diffusion model (pink). c Fractions of the three-component diffusion model and assignment to bound, slow and fast diffusing molecules. Data represents mean values ± s.d. from 400 resamplings with randomly selected 80 % of the data. For experimental statistics see Supplementary Table 5. d) Target site search time (τsearch) of HT-RBPJ-WT as function of the direct association rate (k*on,s). Inset: fold-acceleration of association via facilitated diffusion over direct association as a function of k*on,s. e Target site search time of HT-RBPJ variants at similar ratio of direct to overall dissociation, calculated from data in c), Fig. 2f, g, and Supplementary Table 1 and 4 (Methods). Data represented as value ± s.d. (Gaussian error propagation). Statistics are provided in Supplementary Tables 3 and 5. f Relative luciferase activity of HT-RBPJ- VP16 fusion variants versus their search time. Values denote mean ± s.d. (replot of data from Figs. 1b and 3e). Color code in b, c, e, f as in Fig. 1. Source Data are provided as a Source Data file for Fig. 3b, c, e, f.
Fig. 4
Fig. 4. In vivo binding energy landscape of transcription factors.
a Sketch of binding energy landscapes of a thermodynamically stable and a kinetically stable binding interaction. In both cases, the energy barrier of unbinding and thus the residence time in the bound state is equal. Binding energy differences. Differences in b specific binding energies ΔΔGs and c unspecific binding energies ΔΔGs between HT-RBPJ-WT and mutants, calculated from data in Fig. 2f, g, Fig. 3e and data listed in Supplementary Table 7. Data represented as value ± s.d. (Gaussian error propagation). Statistics are provided in Supplementary Tables 3 and 5. d In vivo chromatin binding energy landscapes of HT-RBPJ variants. Energy differences between bound states or transition barriers and the free state as well as kinetic rates of the target site search process by facilitated diffusion are indicated. Dark gray shade: specific association via unspecific binding and subsequent transition to specific binding; bright gray shade: direct specific association. Only relative, but not absolute energy differences of transition barriers can be obtained. Dotted arrows indicate undetermined rates, limits of the relative transition barriers are given in Supplementary Fig. 9. In vivo chromatin binding energy landscapes of e TALE variants, f SOX2 variants constructed from published kinetic rates, and g GAF variants constructed from published kinetic rates. Color code in bd as in Fig. 1. Source Data are provided as a Source Data file for Fig. 4b–g.

References

    1. Loffreda, A. et al. Live-cell p53 single-molecule binding is modulated by C-terminal acetylation and correlates with transcriptional activity. Nat. Commun.8, 313 (2017). - PMC - PubMed
    1. Popp, A. P., Hettich, J. & Gebhardt, J. C. M. Altering transcription factor binding reveals comprehensive transcriptional kinetics of a basic gene. Nucleic Acids Res.49, 6249–6266 (2021). - PMC - PubMed
    1. Senecal, A. et al. Transcription factors modulate c-Fos transcriptional bursts. CellReports8, 75–83 (2014). - PMC - PubMed
    1. Clauß, K. et al. DNA residence time is a regulatory factor of transcription repression. Nucleic Acids Res.45, 11121–11130 (2017). - PMC - PubMed
    1. Callegari, A. et al. Single-molecule dynamics and genome-wide transcriptomics reveal that NF-kB (p65)-DNA binding times can be decoupled from transcriptional activation. PLoS Genet.15, 1–23 (2019). - PMC - PubMed

LinkOut - more resources