Meta-Analysis
. 2025 Apr;39(5):883-898.
doi: 10.1038/s41433-025-03625-4. Epub 2025 Feb 1.

Visual and patient-reported outcomes of an enhanced versus monofocal intraocular lenses in cataract surgery: a systematic review and meta-analysis

Affiliations
Meta-Analysis

Visual and patient-reported outcomes of an enhanced versus monofocal intraocular lenses in cataract surgery: a systematic review and meta-analysis

Joaquín Fernández et al. Eye (Lond). 2025 Apr.

Abstract

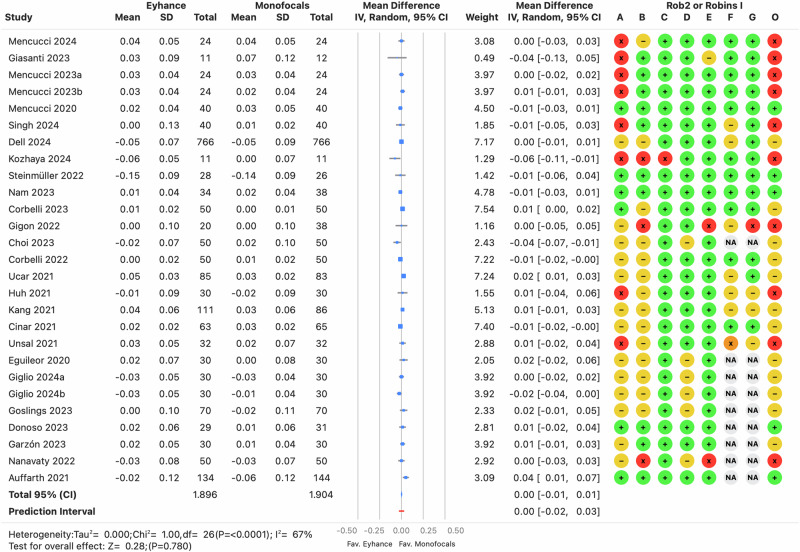
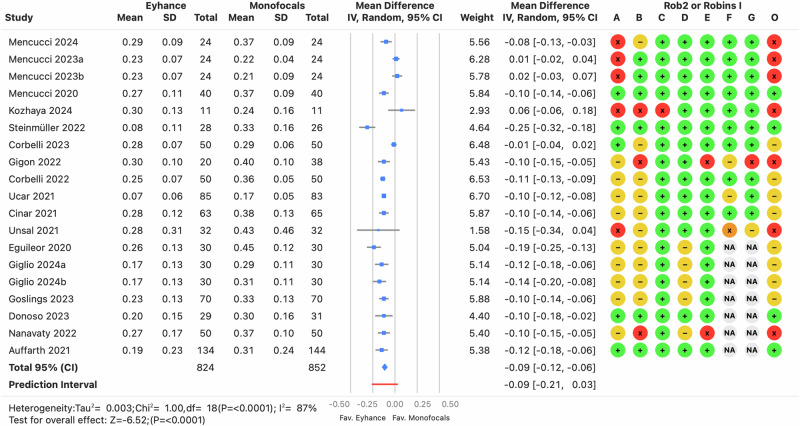
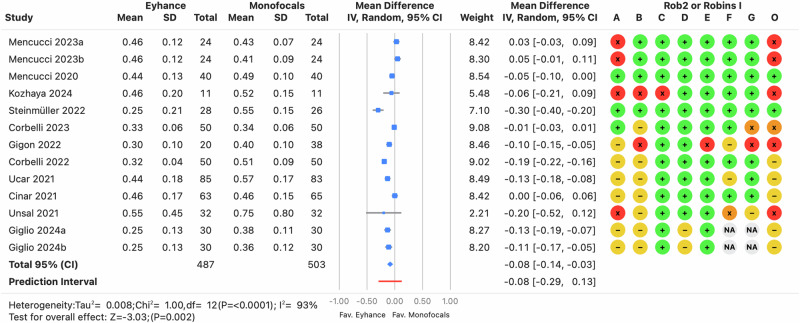
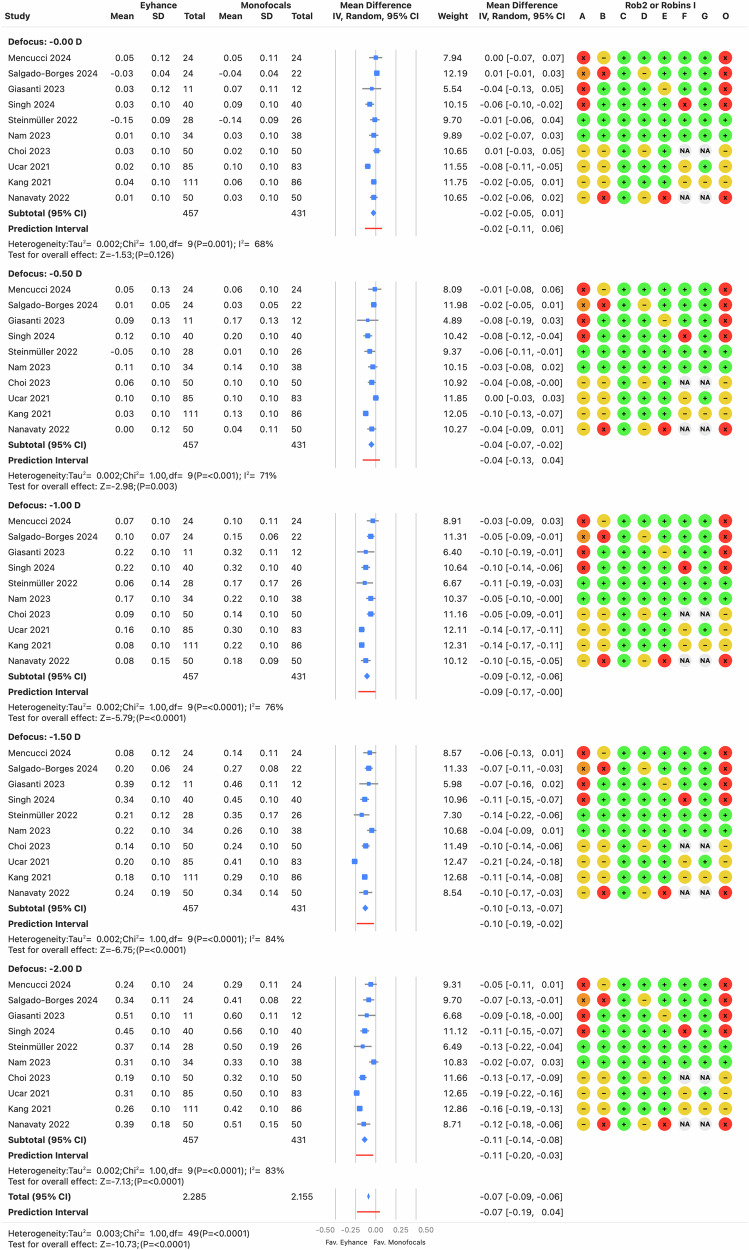
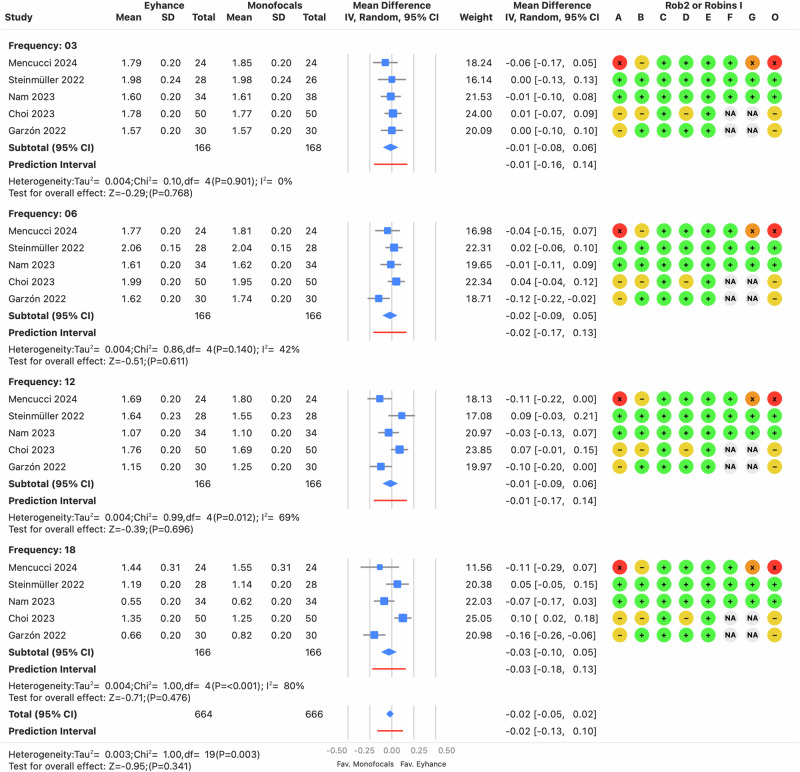
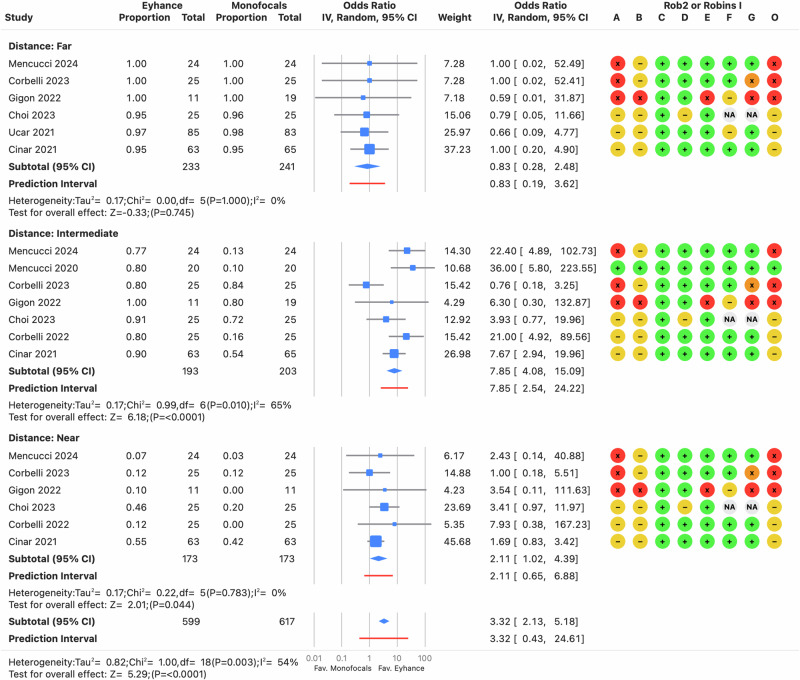
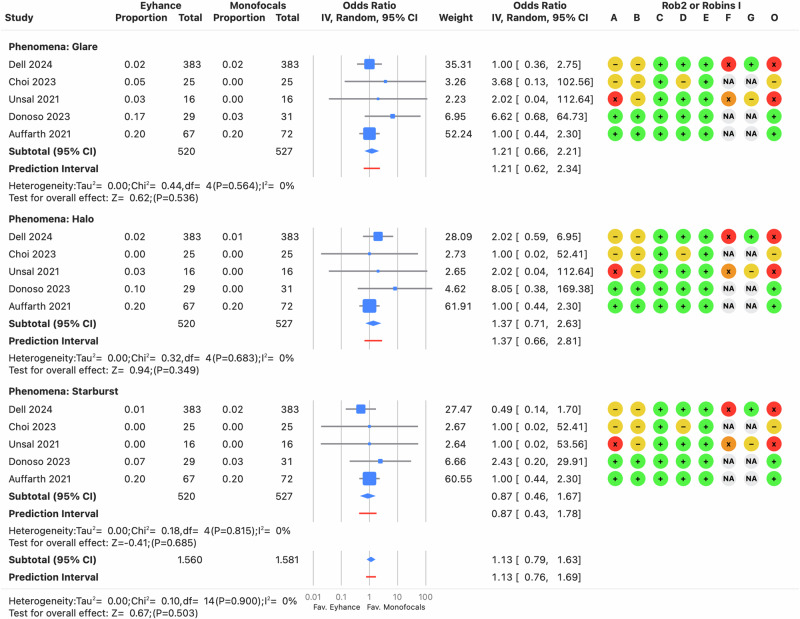
Understanding the functional outcomes achieved with new enhanced monofocal intraocular lenses (IOLs) is crucial for adequately managing patient expectations. This study evaluated visual and patient-reported outcomes of an enhanced range of field IOL versus other monofocal IOLs in cataract patients. A systematic review and meta-analysis, pre-registered on PROSPERO (CRD42024561611), included studies from Medline (PubMed), Embase (Ovid), and trial registries (2019-2024) focused on binocular cataract surgeries with various IOL models. Primary outcomes assessed were monocular distance-corrected visual acuities (CDVA, DCIVA, DCNVA), defocus curves, and contrast sensitivity; secondary measures included binocular visual acuities and patient-reported outcomes such as spectacle independence and photic phenomena. Out of 31 studies (8 randomized clinical trials, 23 case series), high-certainty evidence indicated no significant difference in CDVA between enhanced and conventional IOLs. However, enhanced IOLs demonstrated better intermediate (DCIVA: -0.11 logMAR, CI 95%: -0.13 to -0.10) and near (DCNVA: -0.12 logMAR, CI 95%: -0.17 to -0.07) visual acuities, supported by defocus curves, though with lower-certainty evidence. No significant differences were observed in contrast sensitivity or photic phenomena, and evidence for positive dysphotopsia was moderate to low. Enhanced IOLs significantly favored intermediate-distance spectacle independence, with an odds ratio of 7.85 (CI 95%: 4.08-15.09), though no differences were observed for distance spectacle independence. Near-distance spectacle independence also favored enhanced IOLs, though with low-certainty evidence. In summary, enhanced IOLs provide improved intermediate and near visual acuities compared to conventional monofocal IOLs, though further studies are needed to confirm outcomes in contrast sensitivity and patient-reported outcomes across various enhanced monofocal IOLs.


Conflict of interest statement

Competing interests: JF is a shareholder of Qvision (Indaloftal SL); consultant for Medicontur; grants from Carl Zeiss and Johnson & Johnson; speakers’ bureaus of Carl Zeiss Meditec, Inc.; Oculus, LLC; Staar Surgical; and Bausch + Lomb, Inc; expenses for congresses have been covered by SIFI and Thea. The remaining authors have nothing to disclose.

Figures

Fig. 1
Fig. 1
PRISMA flow diagram for systematic reviews, illustrating the process of database and registry searches.
Fig. 2
Fig. 2. Forest plot of monocular corrected distance visual acuity outcome.
Mean differences from individual studies (blue squares) are displayed in rows, with confidence intervals (CI) represented by horizontal lines. The pooled mean difference from all studies is shown as a diamond, extending to the pooled CI. A red line indicates the prediction interval. Colored circles next to each study represent the risk of bias for each domain (A to G, based on RoB 2 or ROBINS-I) and the overall bias (O). Meta-analysis statistics are summarized at the bottom left.
Fig. 3
Fig. 3. Forest plot of monocular distance-corrected intermediate visual acuity outcome.
Mean differences from individual studies (blue squares) are displayed in rows, with confidence intervals (CI) represented by horizontal lines. The pooled mean difference from all studies is shown as a diamond, extending to the pooled CI. A red line indicates the prediction interval. Colored circles next to each study represent the risk of bias for each domain (A to G, based on RoB 2 or ROBINS-I) and the overall bias (O). Meta-analysis statistics are summarized at the bottom left.
Fig. 4
Fig. 4. Forest plot of monocular distance-corrected near visual acuity outcome.
Mean differences from individual studies (blue squares) are displayed in rows, with confidence intervals (CI) represented by horizontal lines. The pooled mean difference from all studies is shown as a diamond, extending to the pooled CI. A red line indicates the prediction interval. Colored circles next to each study represent the risk of bias for each domain (A to G, based on RoB 2 or ROBINS-I) and the overall bias (O). Meta-analysis statistics are summarized at the bottom left.
Fig. 5
Fig. 5. Forest plot of monocular defocus curve.
Mean differences from individual studies (blue squares) are displayed in rows, with confidence intervals (CI) represented by horizontal lines. The pooled mean difference from all studies is shown as a diamond, extending to the pooled CI. A red line indicates the prediction interval. Colored circles next to each study represent the risk of bias for each domain (A to G, based on RoB 2 or ROBINS-I) and the overall bias (O). Meta-analysis statistics are summarized at the bottom left.
Fig. 6
Fig. 6. Forest plot of monocular contrast sensitivity function.
Mean differences from individual studies (blue squares) are displayed in rows, with confidence intervals (CI) represented by horizontal lines. The pooled mean difference from all studies is shown as a diamond, extending to the pooled CI. A red line indicates the prediction interval. Colored circles next to each study represent the risk of bias for each domain (A to G, based on RoB 2 or ROBINS-I) and the overall bias (O). Meta-analysis statistics are summarized at the bottom left.
Fig. 7
Fig. 7. Forest plot of spectacle independence at far, intermediate, and near distances.
Odds ratio from individual studies (blue squares) are displayed in rows, with confidence intervals (CI) represented by horizontal lines. The pooled mean difference from all studies is shown as a diamond, extending to the pooled CI. A red line indicates the prediction interval. Colored circles next to each study represent the risk of bias for each domain (A to G, based on RoB 2 or ROBINS-I) and the overall bias (O). Meta-analysis statistics are summarized at the bottom left.
Fig. 8
Fig. 8. Forest plot of positive dysphotopsia for halo, glare, and starburst.
Odds ratio from individual studies (blue squares) are displayed in rows, with confidence intervals (CI) represented by horizontal lines. The pooled mean difference from all studies is shown as a diamond, extending to the pooled CI. A red line indicates the prediction interval. Colored circles next to each study represent the risk of bias for each domain (A to G, based on RoB 2 or ROBINS-I) and the overall bias (O). Meta-analysis statistics are summarized at the bottom left.

Similar articles

Cited by

References

    1. Eyewire. New Technology, Greater Patient Awareness Will Help Drive Gains in Premium Cataract Surgery. Source: Market Scope’s “2021 Premium Cataract Surgery Market Report”. 2021. https://eyewire.news/news/new-technology-greater-patient-awareness-will-.... Accessed Dec 14 2023.
    1. Fernández J, Ribeiro F, Rocha-de-Lossada C, Rodríguez-Vallejo M. Functional classification of intraocular lenses based on defocus curves: a scoping review and cluster analysis. J Refract Surg. 2024;40:e108–16. - PubMed
    1. Mencucci R, Cennamo M, Venturi D, Vignapiano R, Favuzza E. Visual outcome, optical quality, and patient satisfaction with a new monofocal IOL, enhanced for intermediate vision: preliminary results. J Cataract Refract Surg. 2020;46:378–87. - PubMed
    1. Fernández J, Rocha-de-Lossada C, Zamorano-Martín F, Rodríguez-Calvo-de-Mora M, Rodríguez-Vallejo M. Positioning of enhanced monofocal intraocular lenses between conventional monofocal and extended depth of focus lenses: a scoping review. BMC Ophthalmol. 2023;23:101. - PMC - PubMed
    1. Wan KH, Au ACK, Kua WN, Ng ALK, Cheng GPM, Lam NM, et al. Enhanced monofocal versus conventional monofocal intraocular lens in cataract surgery: a meta-analysis. J Refract Surg. 2022;38:538–46. - PubMed

MeSH terms

LinkOut - more resources