

Genome-wide association mapping and genomic prediction analyses reveal the genetic architecture of grain yield and agronomic traits under drought and optimum conditions in maize
- PMID: 39893411
- PMCID: PMC11786572
- DOI: 10.1186/s12870-025-06135-3
Genome-wide association mapping and genomic prediction analyses reveal the genetic architecture of grain yield and agronomic traits under drought and optimum conditions in maize
Abstract
Background: Drought is a major abiotic stress in sub-Saharan Africa, impacting maize growth and development leading to severe yield loss. Drought tolerance is a complex trait regulated by multiple genes, making direct grain yield selection ineffective. To dissect the genetic architecture of grain yield and flowering traits under drought stress, a genome-wide association study (GWAS) was conducted on a panel of 236 maize lines testcrossed and evaluated under managed drought and optimal growing conditions in multiple environments using seven multi-locus GWAS models (mrMLM, FASTmrMLM, FASTmrEMMA, pLARmEB, pKWmEB, ISIS EM-BLASSO, and FARMCPU) from mrMLM and GAPIT R packages. Genomic prediction with RR-BLUP model was applied on BLUEs across locations under optimum and drought conditions.
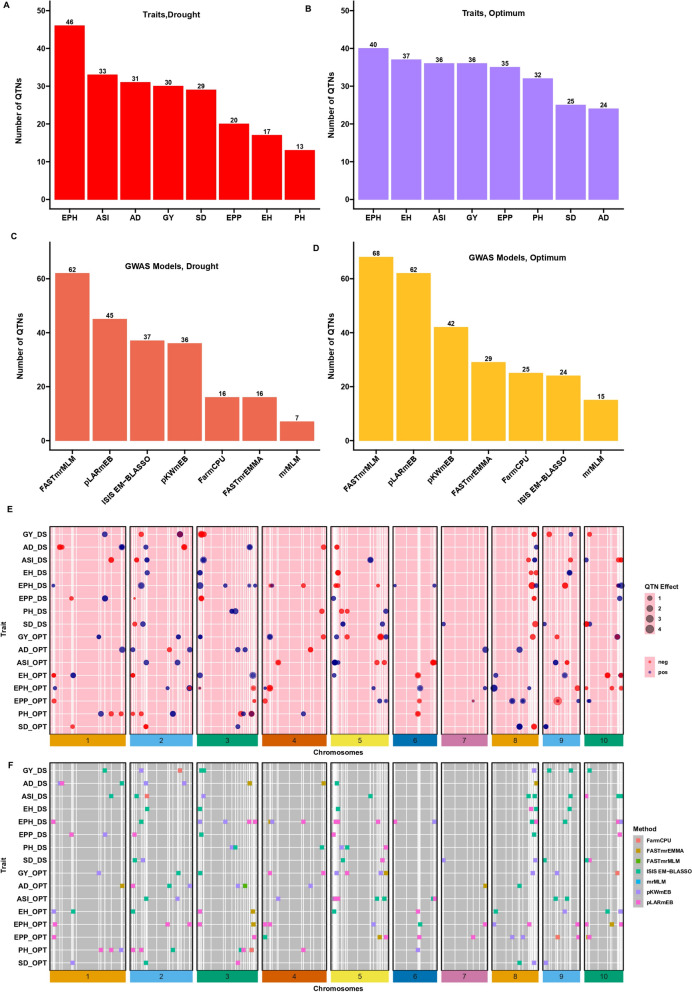
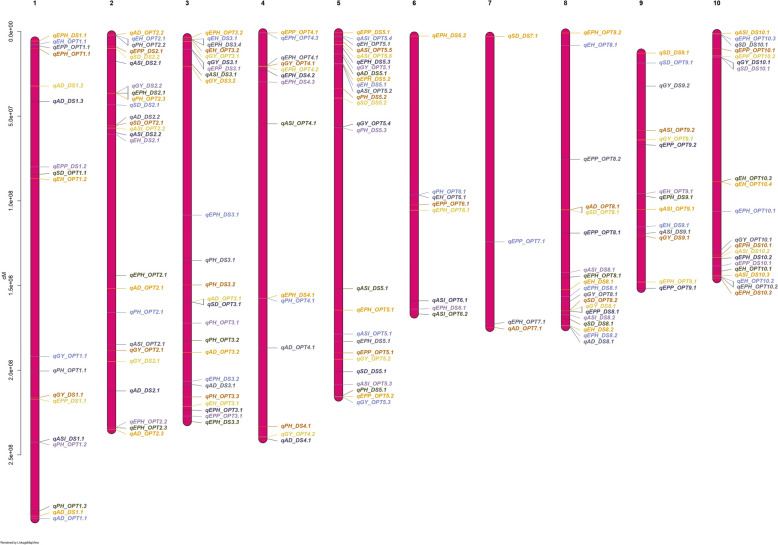
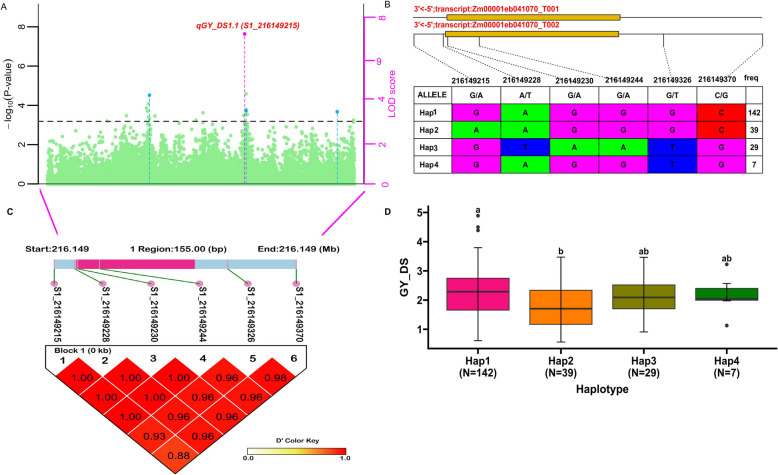
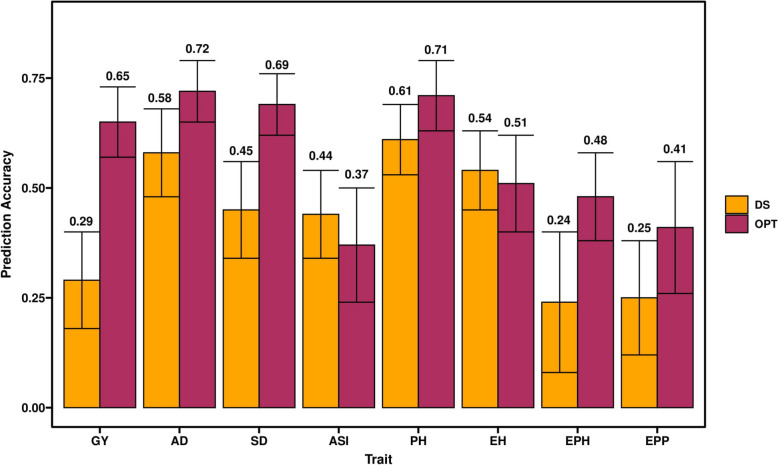
Results: A total of 172 stable and reliable quantitative trait nucleotides (QTNs) were identified, of which 77 are associated with GY, AD, SD, ASI, PH, EH, EPO and EPP under drought and 95 are linked to GY, AD, SD, ASI, PH, EH, EPO and EPP under optimal conditions. Among these QTNs, 17 QTNs explained over 10% of the phenotypic variation (R2 ≥ 10%). Furthermore, 43 candidate genes were discovered and annotated. Two major candidate genes, Zm00001eb041070 closely associated with grain yield near peak QTN, qGY_DS1.1 (S1_216149215) and Zm00001eb364110 closely related to anthesis-silking interval near peak QTN, qASI_DS8.2 (S8_167256316) were identified, encoding AP2-EREBP transcription factor 60 and TCP-transcription factor 20, respectively under drought stress. Haplo-pheno analysis identified superior haplotypes for qGY_DS1.1 (S1_216149215) associated with the higher grain yield under drought stress. Genomic prediction revealed moderate to high prediction accuracies under optimum and drought conditions.
Conclusion: The lines carrying superior haplotypes can be used as potential donors in improving grain yield under drought stress. Integration of genomic selection with GWAS results leads not only to an increase in the prediction accuracy but also to validate the function of the identified candidate genes as well increase in the accumulation of favorable alleles with minor and major effects in elite breeding lines. This study provides valuable insight into the genetic architecture of grain yield and secondary traits under drought stress.
Keywords: Drought; Genome-wide association study; Genomic prediction; Haplotype; Maize; Yield.
© 2025. The Author(s).
Conflict of interest statement
Declarations. Ethics approval and consent to participate: All experimental studies on plants complied with relevant institutional, national, and international guidelines and legislation. Consent for publication: Not applicable. Competing interests: The authors declare no competing interests.
Figures
Similar articles
-
Genome-wide association studies and whole-genome prediction reveal the genetic architecture of KRN in maize.BMC Plant Biol. 2020 Oct 27;20(1):490. doi: 10.1186/s12870-020-02676-x. BMC Plant Biol. 2020. PMID: 33109077 Free PMC article.
-
Multi-locus genome-wide association mapping for major agronomic and yield-related traits in sorghum (Sorghum bicolor (L.) moench) landraces.BMC Genomics. 2025 Mar 28;26(1):304. doi: 10.1186/s12864-025-11458-4. BMC Genomics. 2025. PMID: 40155810 Free PMC article.
-
Combination of multi-locus genome-wide association study and QTL mapping reveals genetic basis of tassel architecture in maize.Mol Genet Genomics. 2019 Dec;294(6):1421-1440. doi: 10.1007/s00438-019-01586-4. Epub 2019 Jul 9. Mol Genet Genomics. 2019. PMID: 31289944
-
Genetic, molecular and physiological crosstalk during drought tolerance in maize (Zea mays): pathways to resilient agriculture.Planta. 2024 Aug 28;260(4):81. doi: 10.1007/s00425-024-04517-9. Planta. 2024. PMID: 39196449 Review.
-
Using genetic mapping and genomics approaches in understanding and improving drought tolerance in pearl millet.J Exp Bot. 2011 Jan;62(2):397-408. doi: 10.1093/jxb/erq265. Epub 2010 Sep 5. J Exp Bot. 2011. PMID: 20819788 Review.
Cited by
-
Genetic Dissection of Drought Tolerance in Maize Through GWAS of Agronomic Traits, Stress Tolerance Indices, and Phenotypic Plasticity.Int J Mol Sci. 2025 Jun 29;26(13):6285. doi: 10.3390/ijms26136285. Int J Mol Sci. 2025. PMID: 40650063 Free PMC article.
-
Drought stress memory in maize: understanding and harnessing the past for future resilience.Plant Cell Rep. 2025 Apr 25;44(5):101. doi: 10.1007/s00299-025-03494-x. Plant Cell Rep. 2025. PMID: 40278890 Review.
References
-
- Erenstein O, Jaleta M, Sonder K, Mottaleb K, Prasanna BM. Global maize production, consumption and trade: Trends and R&D implications. Food Secur. 2022;14:1295–319.
-
- FAO. The Global Action for Fall Armyworm Control: Action framework 2020–2022. Working together to tame the global threat. Rome: 2020.
-
- Prasanna BM, Nair SK, Babu R, Gowda M, Zhang X, Xu Y, et al. Increasing genetic gains in maize in stress-prone environments of the tropics. In: Kole C, editor. Genomic Designing of Climate-Smart Cereal Crops. Cham: Springer International Publishing; 2020. p. 97–132.
MeSH terms
Grants and funding
LinkOut - more resources
Full Text Sources
Research Materials
