. 2025 Feb 1;13(1):21.
doi: 10.1186/s40478-025-01927-y.

Kaempferol enhances ER-mitochondria coupling and protects motor neurons from mitochondrial dysfunction and ER stress in C9ORF72-ALS

Affiliations

Kaempferol enhances ER-mitochondria coupling and protects motor neurons from mitochondrial dysfunction and ER stress in C9ORF72-ALS

Federica Pilotto et al. Acta Neuropathol Commun. .

Abstract

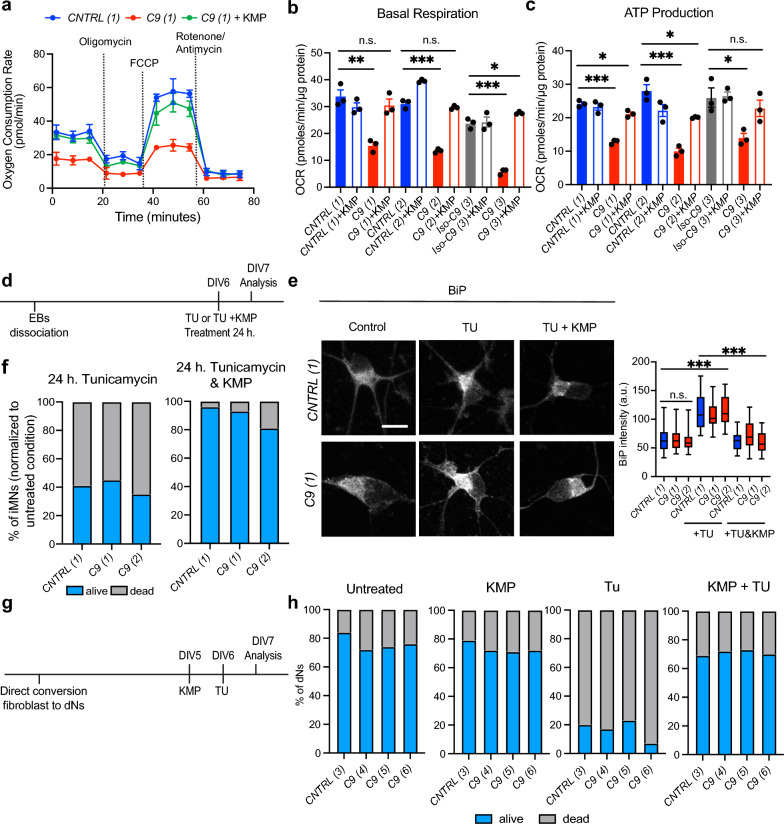
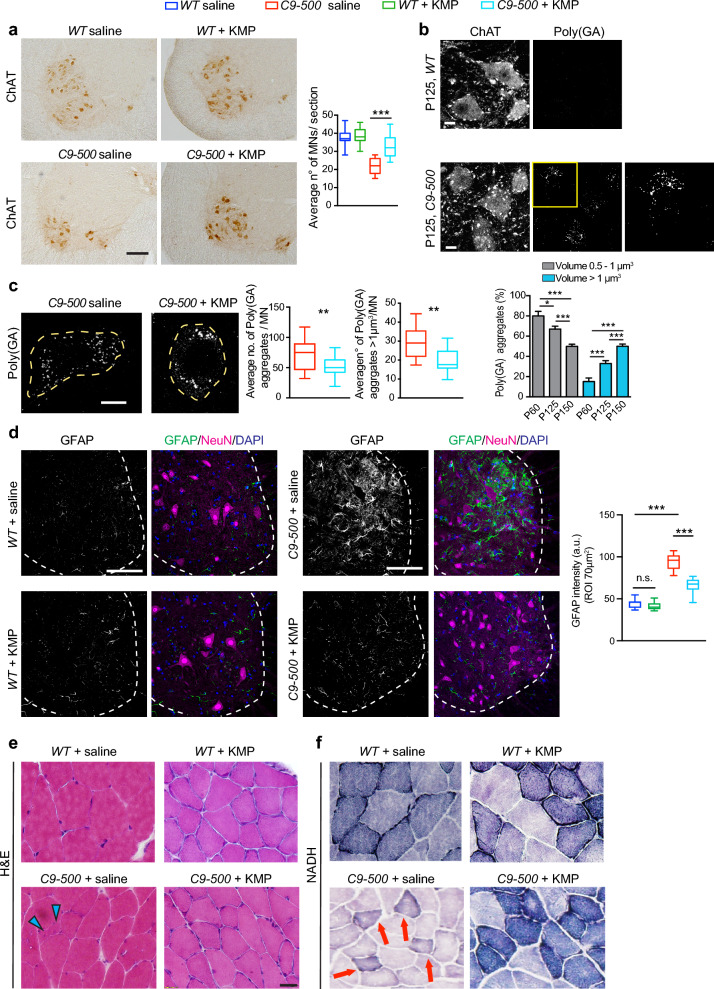
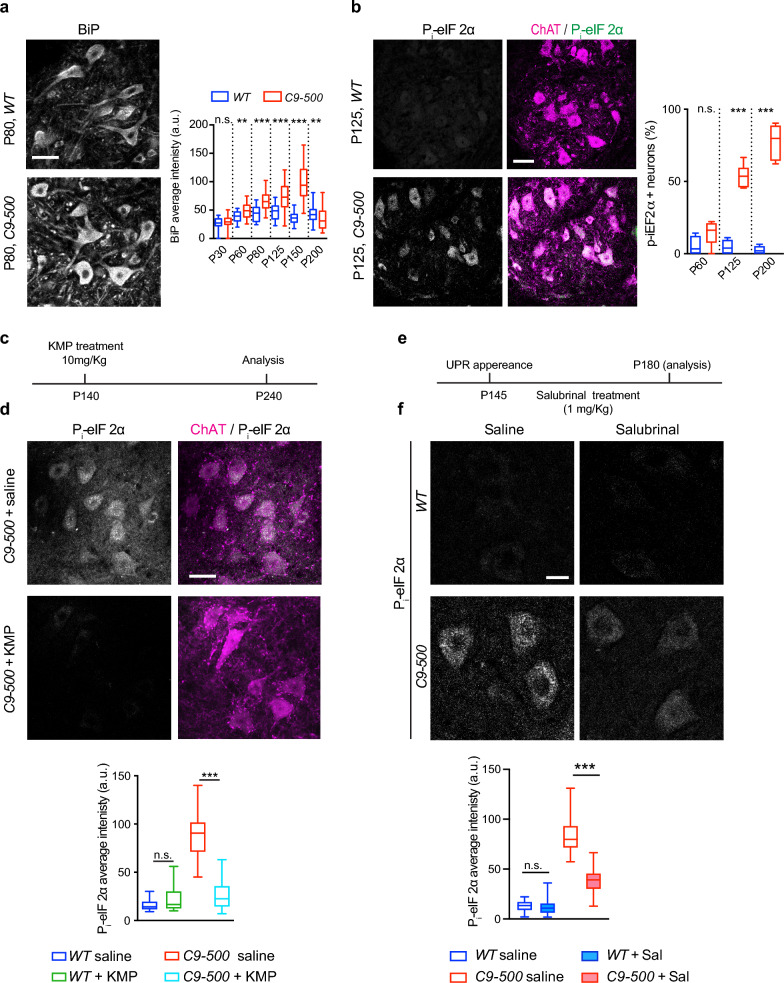
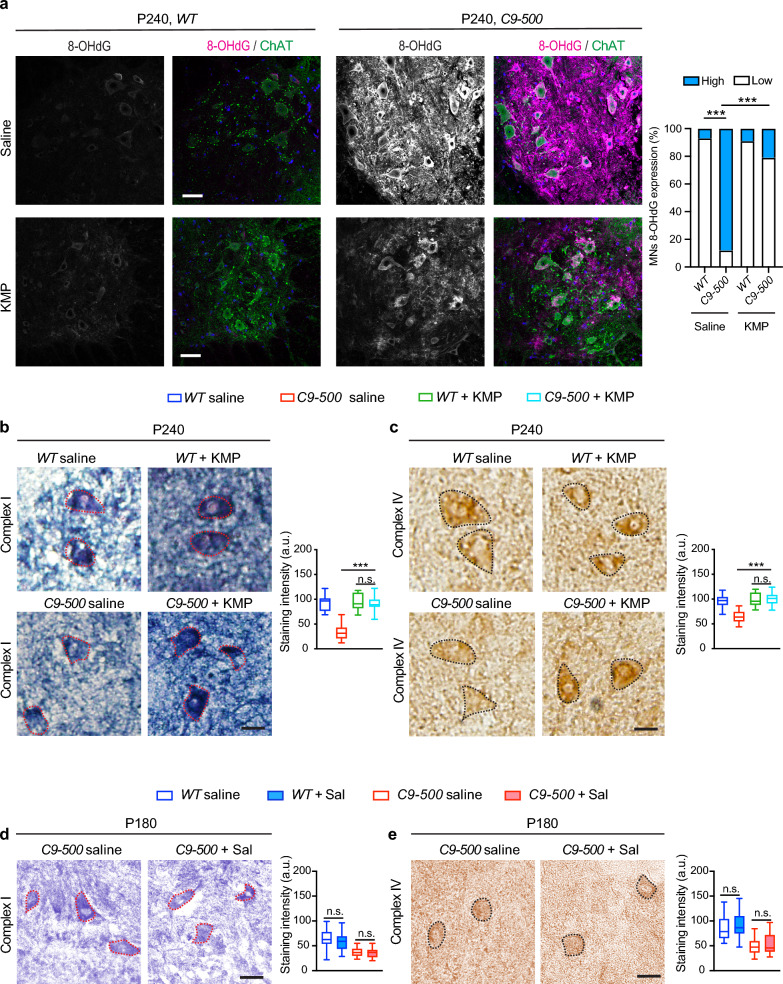
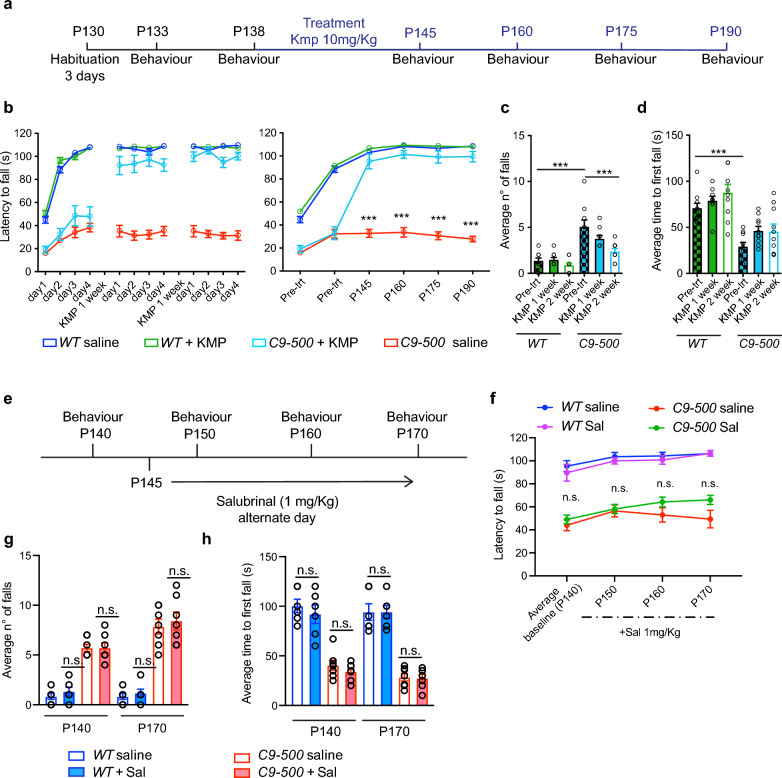
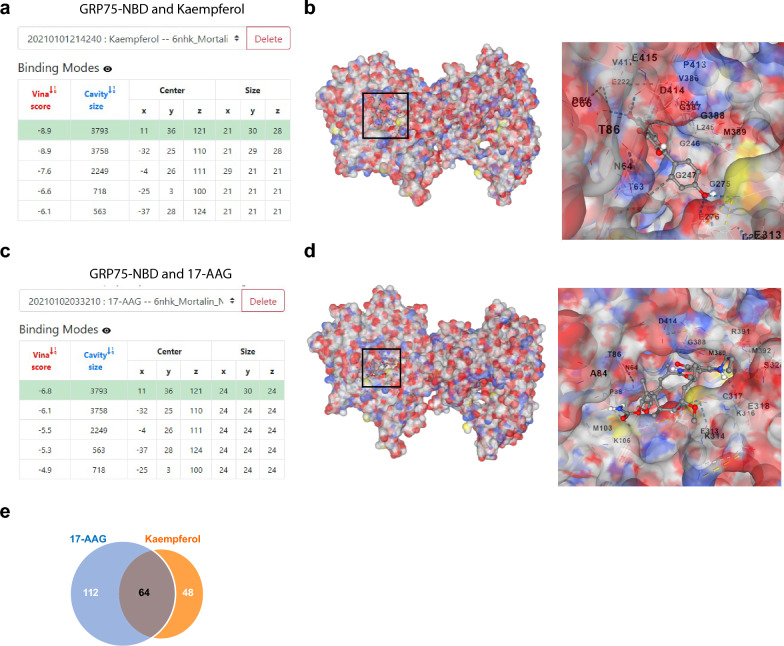
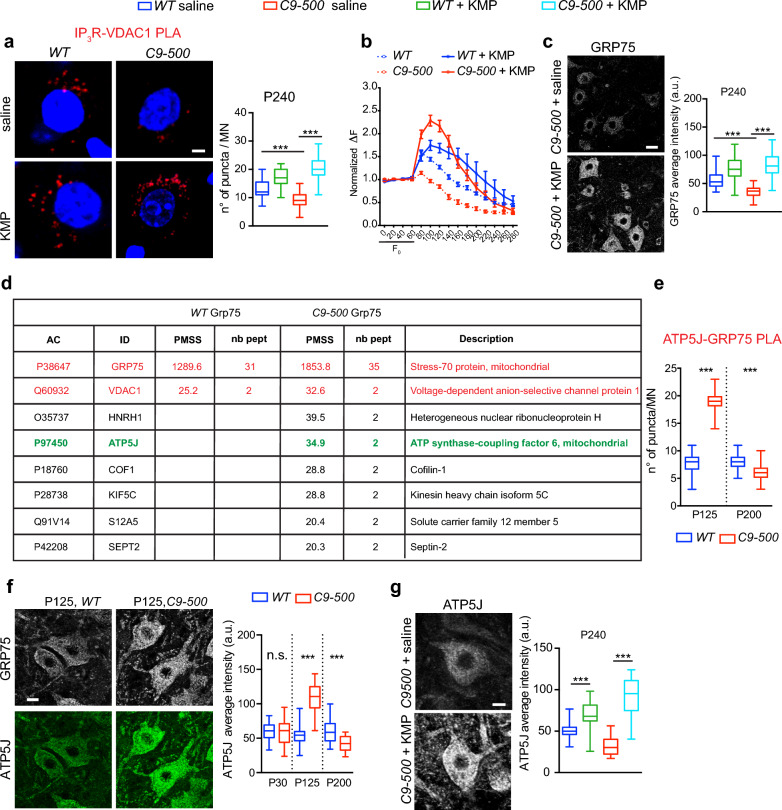
Repeat expansions in the C9ORF72 gene are a frequent cause of amyotrophic lateral sclerosis (ALS) and frontotemporal dementia. Considerable progress has been made in identifying C9ORF72-mediated disease and resolving its underlying etiopathogenesis. The contributions of intrinsic mitochondrial deficits as well as chronic endoplasmic reticulum stress to the development of the C9ORF72-linked pathology are well established. Nevertheless, to date, no cure or effective therapy is available, and thus attempts to find a potential drug target, have received increasing attention. Here, we investigated the mode of action and therapeutic effect of a naturally occurring dietary flavanol, kaempferol in preclinical rodent and human models of C9ORF72-ALS. Notably, kaempferol treatment of C9ORF72-ALS human patient-derived motor neurons/neurons, resolved mitochondrial deficits, promoted resiliency against severe ER stress, and conferred neuroprotection. Treatment of symptomatic C9ORF72 mice with kaempferol, normalized mitochondrial calcium uptake, restored mitochondria function, and diminished ER stress. Importantly, in vivo, chronic kaempferol administration ameliorated pathological motor dysfunction and inhibited motor neuron degeneration, highlighting the translational potential of kaempferol. Lastly, in silico modelling identified a novel kaempferol target and mechanistically the neuroprotective mechanism of kaempferol is through the iP3R-VDAC1 pathway via the modulation of GRP75 expression. Thus, kaempferol holds great promise for treating neurodegenerative diseases where both mitochondrial and ER dysfunction are causally linked to the pathophysiology.


Conflict of interest statement

Declarations. Animal experiments: The study was approved by the Animal Commission of Canton of Bern, Switzerland, license number BE-35/17, BE-82/18. Human fibroblast-derived cells: Cells were anonymized and provided to us under an MTA from respective consortia. Culturing of cells only did not require internal review board (IRB) approval. Consent for publication: All authors have approved the manuscript and agree with its submission. Competing interests: The authors declare that they have no competing interests.

Figures

Fig. 1
Fig. 1
KMP restores mitochondria impairments and inhibits  ER stress in C9ORF72 neurons. a Seahorse graph plotted for oxygen consumption rate (OCR) on y-axis with time on X-axis. Representative traces of mitochondrial respiration from Ctrl(1) and C9(1) iMNs, showing mitochondrial functional deficits in C9ORF72 patient line at one week, but those deficits are normalized after KMP treatment. b Mitochondrial oxygen consumption rate analysis on iMNs reveals impairments in basal respiration in all three C9ORF72 patient lines compared to healthy control or respective isogenic control. Basal respiration is restored to control level after KMP treatment (Unpaired t-test: CNTRL (1) vs C9 (1) ***; CNTRL (1) vs C9 (1) + KMP n.s.; CNTRL (2) vs C9 (2) ***; CNTRL (2) vs C9 (2) + KMP n.s.; Iso-C9 (3) vs C9 (3) *; Iso-C9 (3) vs C9 (3) + KMP *). The experiment was performed in triplicates from three different batches of iPSC conversion to iMNs. c Mitochondria OCR analysis on iMNs reveals impairments in ATP production in all C9ORF72 patient lines compared to healthy control or respective isogenic. ATP production is restored to the control level after KMP treatment (Unpaired t-test: CNTRL (1) vs C9 (1) **; CNTRL (1) vs C9 (1) + KMP * CNTRL (2) vs C9 (2) ***; CNTRL (2) vs C9 (2) + KMP *; Iso-C9 (3) vs C9 (3) *; Iso-C9 (3) vs C9 (3) + KMP n.s.). Experiment was performed in triplicates from three iPSC batches converted to iMNs . d Schematic depiction of the experimental timeline for iMNs TU treatment and TU treatment combined with 24 h of KMP. e Representative confocal images of BiP immunostaining in iMNs, quantitative analysis revealed an increase in BiP expression after 24 h TU treatment, whereas ER stress was completely inhibited after TU + KMP treatment. (Unpaired t-test: CNTRL (1–2) vs C9 (1.2) n.s. Iso-C9 (3) vs C9 (3) n.s.; CNTRL (1–2) vs CNTRL (1–2) + TU***; C9 (1–2) vs C9 (1–2) + TU***; Iso-C9 (3) vs Iso-C9 (3) + TU ***; C9 (3) vs C9 (3) + TU ***; CNTRL (1–2) + TU vs CNTRL (1–2) + TU + KMP ***; C9 (1–2) + TU vs C9 (1–2) + TU + KMP***; Iso-C9 (3)) + TU vs Iso-C9 (3)) + TU + KMP ***; C9 (3) + TU vs C9 (3) + TU) + KMP***). Scale bars: 100 μm. f CNTRL and C9 iMNs treated with TU displayed significant cell death, whereas the addition of KMP for 24 h was found to be neuroprotective (TU: CNTRL (1) 41% alive vs 59% dead; C9 (1) 45% alive vs 55% dead; C9 (2) 35% alive vs 65% dead; TU + KMP: CNTRL (1) 96% alive vs 4% dead; C9 (1) 93% alive vs 7% dead; C9 (2) 81% alive vs 19% dead). Scale bars: 10 μm. g Schematic depiction of the experimental timeline for dNs generation, TU treatment and TU treatment combined with 24 h of KMP. h CNTRL and C9 dNs treated with TU displayed significant cell death, whereas those treated with KMP for 24 h were resilient to ER stress-induced neurodegeneration
Fig. 2
Fig. 2
Kaempferol promotes motor neuron survival and reduces pathology progression. a Immunohistochemical staining for MN marker ChAT and quantitative analyses. reveals significant differences in motor neuron numbers between C9-500 mice treated with KMP until the end stage of the disease at P240 and the saline group (Unpaired t-test: C9-500 + saline mean ± SEM 21.75 ± 1.097 vs C9-500 + KMP mean ± SEM 32.48 ± 1.127, t = 6.455, P < 0.0001). Scale bar = 150 μm. b ChAT-positive C9-500 MNs from C9-500 mice show in an age-dependent manner the accumulation of greater than 1µm3 poly-GA aggregates. (MN numbers: P60 C9-500: n = 42; P125 C9-500: n = 47; P150 C9-500: n = 38; from 4 mice/genotype/age). Scale bar: 30 μm. c Quantitative analyses of Poly(GA) aggregates reveal a significant reduction in the number of aggregates in C9-500 mice treated with KMP (Unpaired t-test: C9-500 + saline: n = 19 MNs vs C9-500 + KMP; n = 22 MNs, t = 3.110, P = 0.0035**). Quantitative analysis of PolyGA aggregate volume reveals a significant decrease in > 1 μm3 aggregates within spinal MN after KMP treatment (Unpaired t-test: C9-500 + saline: n = 19 MNs vs C9-500 + KMP; n = 22 MNs, t = 3.632, P = 0.0011**). n = 4–5 mice/genotype/treatment. Scale bar: 10 μm. d Representative confocal images of GFAP staining and quantitative analysis. Note the reduced astrogliosis in C9-500 animals treated with KMP (Unpaired t-test: C9-500 + saline vs C9-500 + KMP (t = 5.789, P < 0.0001***). e Representative images of muscle sections with staining for H&E from C9-500 mice treated with saline and KMP. Blue arrowheads in the H&E images point to small, and degenerating fibers that are not present in C9-500 mice treated with KMP. Scale bar: 100 μm. f Representative images of muscle sections with staining NADH from C9-500 mice treated with saline and KMP. Red arrows in the NADH staining point to small and degenerating fibers that are not present in C9-500 mice treated with KMP. Moreover, the NADH staining presents pale fibres in C9-500 saline animals while in KMP-treated C9-500 mice, a strong checkboard pattern is present. Scale bar: 150 μm
Fig. 3
Fig. 3
C9-500 MNs exhibit early and progressive ER stress and UPR signaling, which is attenuated by kaempferol treatment. a Representative images immunolabeled for ER stress marker BiP in WT and C9-500 spinal cord, reveals an increase in BiP intensity within ChAT-positive mutant MNs at P80. The graph on the right depicts quantitative analyses of BiP expression, showing an age-dependent increase within C9-500 motor neurons as measured in arbitrary units (a.u.). (Unpaired t-test, motor neuron numbers: at P30 WT, n = 18 vs C9-500, n = 18, t = 0.6159, df = 34 n.s. P = 0.5421; at P60 WT, n = 29 vs C9-500, n = 28, t = 3.353, df = 55 **P = 0.0015; at P80 WT, n = 27 vs C9-500, n = 38, t = 5.741, df = 63,***P < 0.0001; at P125 WT, n = 21 vs C9-500, n = 39, t = 4.804, df = 58 ***P < 0.0001; at P150 WT, n = 41 vs C9-500, n = 53, t = 12.74, df = 92, ***P < 0.0001; at P200 WT, n = 58 vs C9-500, n = 57, t = 27.11, df = 113, **P = 0.0078). Scale bar = 30 μm, n = 4–5 mice/genotype/age. b Representative images depicting the appearance of UPR signaling in C9-500 MNs as measured by the presence of phosphorylated eIF2α (Pi-eIF2α) from P125, which encompasses 78% ± 3.403 MNs by P200. Number of ChAT + ve motor neurons analysed at P60 WT, n = 85 & C9-500, n = 94, at P125 WT, n = 82 & C9-500, n = 91, at P200 WT, n = 192 & C9-500, n = 151). Scale bar = 20 μm, n = 3 mice/genotype/age. c Schematic depiction of the experimental timeline for in vivo treatment of symptomatic C9-500 mice with kaempferol (KMP) until the end stage of disease P240. Initial short treatment lasting for two weeks was performed by daily intraperitoneal (i.p.,) injection of kaempferol, followed by injection every alternate day up to P240. d Representative images showing the activation of UPR via the expression of Pi-eIF2α between saline-treated and KMP-treated C9-500 mice. Quantitative analyses of Pi-eIF2α expression reveal a significant reduction in UPR levels in C9-500 MNs after KMP treatment compared to saline controls. One-way ANOVA: P < 0.0001*** F = 48.47, Sidak’s multiple comparisons: WT + saline vs WT + KMP n.s. C9-500 + saline vs C9-500 + KMP***. Scale bar = 30 μm. e Scheme showing Sal training schedule. Representative images of Pi-Eif2α from saline and Sal-treated WT and C9-500 animals. f Representative images showing the activation of UPR via the expression of Pi-eIF2α between saline-treated and ER stress inhibitor Sal-treated C9-500 mice. Quantitative analyses show reduced expression of Pi-eIF2α. (One-way ANOVA, F = 306.6, P < 0,0001, Sidak’s multiple comparison test: WT vs WT + Sal, n.s.; C9-500 vs C9-500 + Sal,***). Scale bar = 20 μm, n = 3 animals per genotype/group
Fig. 4
Fig. 4
Kaempferol treatment ameliorates mitochondrial function in mutant C9-500 MNs. a Representative confocal images showing 8-OHdG expression levels within MNs. Quantification analyses of intensity and relative percentage of MNs expressing high and low levels of oxidative stress (low expressing MNs: WT saline 93%, WT + KMP 91%, C9-500 saline 12%, C9-500 + KMP 88%; high expressing MNs: WT saline 7%, WT + KMP 9%, C9-500 + saline 88%, C9-500 + KMP 21%. Chi square test: WT saline vs C9-500 + saline; P < 0.0001***; C9-500 + saline vs C9-500 + KMP: P < 0.0001***) Scale bars: 50 μm. b Representative images showing Complex I activity via the NADH dehydrogenase catalyzed redox reaction within MNs, traced with dotted red lines. Quantification analyses of staining intensity for Complex I of the mitochondria respiratory chain show that KMP treatment significantly improves Complex I activity within C9-500 MNs. Note the negligible blue coloration for Complex I within motor neurons (Unpaired t-test, Complex I: C9-500 + saline n = 45 vs C9-500 + KMP n = 21, t = 16.32, P < 0.0001. Scale bars: 30 μm. c Representative images showing Complex IV activity via cytochrome c oxidation, traced with dotted black lines. Quantification analyses of staining intensity for the Complex IV of the mitochondria respiratory chain reveal that KMP treatment significantly improves Complex IV activity within C9-500 MNs. Note the pale-yellow coloration for Complex IV within motor neurons, indicative of a dysfunction in the mitochondrial respiratory chain. (Unpaired t-test, Complex IV: C9-500 + saline n = 21 vs C9-500 + KMP n = 29, t = 8.449, P < 0.0001). Scale bars: 30 μm. d Representative images of mitochondrial respiratory Complex I staining within C9-500 spinalMNs, traced with red dotted lines. Note the non-significant changes in Complex I levels in the spinal cord of C9-500 treated with ER stress inhibitor Sal (Complex I, One-way ANOVA: F = 28.35, P < 0,0001, Sidak’s multiple comparison test: WT vs W T + Sal, n.s.; C9-500 vs C9-500 + Sal, n.s. Scale bars: 100 μm. e Representative images of mitochondrial respiratory Complex IV staining within C9-500 spinal MNs, traced with black dotted lines. No changes in Complex IV levels in the spinal cord of C9-500 treated with Sal are observed. (Complex IV One-way ANOVA: F = 25.72, P < 0,0001, Sidak’s multiple comparison test: WT vs WT + Sal, n.s.; C9-500 vs C9-500 + Sal, n.s.). Scale bars: 100 μm
Fig. 5
Fig. 5
Kaempferol but not Salubrinal trt. rescues behavioral phenotype in symptomatic C9-500 mice. a Schematic depiction of the experimental timeline for in vivo treatment of symptomatic C9-500 mice with KMP. Initial short treatment lasting for two weeks was performed by daily intraperitoneal (i.p.,) injection of KMP. This was followed by injection every alternate day up to P190. b Reverse rotarod plotted as latency to fall, C9-500 mice treated with KMP show significant improvement in motor performance compared to C9-500 saline treated group. Note the substantial improvement in motor performance to near normal WT levels, already one week after KMP treatment, which is sustained after two weeks of KMP treatment as well as until late disease stage at P190. (Number of animals: 10 WT + saline; 10 C9-500 + saline; 10 WT + KMP; and 11 C9-500 + KMP). Two-way ANOVA: interaction P =  < 0.0001***, F (15,216) = 21.95, time P < 0.0001*** F (5,216) = 197.2, treatment P < 0.0001***, F (3,216) = 580.1, Bonferroni post hoc. WT + saline vs C9-500 + saline ***; C9-500 + saline vs C9-500 + KMP ***. c Hanging wire test showing muscle performance in WT and C9-500 mice before and after KMP treatment. The total number of falls within a period of 2 min were significantly higher in C9-500 mice group than WT mice cohort. However, continuous KMP treatment significantly reduced the number of falls within C9-500 after KMP treated group as compared to C9-500 before KMP treatment (Number of animals: 10 WT pre-trt., 10 C9-500 pre-trt.; 10 WT + KMP; and 10 C9-500 + KMP). One way ANOVA: P < 0.0001*** F = 18.15, Sidak’s multiple comparisons: WT pre-trt. vs C9-500 pre-trt. ***; C9-500 pre-trt. vs C9-500 + KMP (2 weeks) ***. d Hanging wire test showing muscle performance in WT and C9-500 mice before and after KMP treatment. No significant difference was observed in the C9-500 mice cohort in the timing to first fall after one week of KMP treatment, but significant improvement was observed after 2 weeks of KMP treatment. number of falls, One way ANOVA: P < 0.0001*** F = 13.84, Sidak’s multiple comparisons: WT pre-trt. vs C9-500 pre-trt. ***; C9-500 pre-trt. vs C9-500 + KMP (2 weeks) n.s. Time to first fall; One way ANOVA: P < 0.0001***, F = 9.246, Sidak’s multiple comparisons: WT pre-trt. vs C9-500 pre-trt. **; C9-500 pre-trt. vs C9-500 + KMP n.s. e Schematic depiction of the experimental timeline for in vivo treatment of symptomatic C9-500 mice with Sal, which was performed by intraperitoneal (i.p,) injection of Sal every alternate day to avoid nephrotoxicity in mice. Treatment was stopped at P170, following the animal ethics guidelines as no beneficial effect of the treatment was observed. f Inverse Rotarod test presented as latency to fall, does not show significant improvement in C9-500 mice after Sal treatment (Two-way ANOVA: interaction F (9,92) = 0.9044, n.s.; Age F(3,92) = 5.3**.; treatment F(3,92) = 120***, Sidak’s multiple comparisons test C9-500 + saline vs C9-500 + Sal: P140 n.s; P150 n.s.; P160 n.s.; P170 n.s.). n = 6 WT + saline, 6 WT + Sal, n = 8 C9-500 + saline, n = 8 C9-500 + Sal. g Hanging wire test performed at P140 and P170, showing no significant improvement in C9-500 animals after Sal treatment in the average number of falls within a period of 2 min. (One way ANOVA no. of falls: F = 34.60***, Sidak’s multiple comparison at P140: WT + saline vs C9-500 + saline ***, WT + Sal vs C9-500 + Sal ***, C9-500 + saline vs C9-500 + Sal n.s.; at P170: WT + saline vs C9-500 + saline ***, WT + Sal vs C9-500 + Sal ***, C9-500 + saline vs C9-500 + Sal n.s.). h Hanging wire test performed at P140 and P170, showing no significant improvement in the time taken to first fall is observed in C9-500 animals after Sal treatment (One way ANOVA average time to first fall: F = 31.96,***, Sidak’s multiple comparisons at P140: WT + saline vs C9-500 + saline***, WT + Sal vs C9-500 + Sal ***, C9-500 + Saline vs C9-500 + Sal n.s.; at P170: WT + saline vs C9-500 + saline ***, WT + Sal vs C9-500 + Sal ***, C9-500 + saline vs C9-500 + Sal n.s.)
Fig. 6
Fig. 6
In silico modeling reveals preferential Kaempferol binding to the nucleotide-binding domain of GRP75. a Table depicting Vina scores, and cavity information of the docking simulation pose for GRP75 nucleotide-binding domain (NBD) and KMP. b The structure of KMP was uploaded to CB-Dock for analysis of the docking potential with GRP75. The crystal structure of the human GRP75 nucleotide-binding domain (PDB ID: 6NHK), the active site is colored white (carbon), red (oxygen), blue (nitrogen), and yellow (sulphur). The crystal pose of the ligand KMP in the cavity sized 3793 is colored white (hydrogen), grey (carbon), and red (oxygen). c Table depicting Vina scores, and cavity information of the docking simulation pose for GRP75 nucleotide-binding domain (NBD) and 17-AAG. d The crystal structure of the human GRP75 nucleotide-binding domain (PDB ID: 6NHK), the active site is colored white (carbon), red (oxygen), blue (nitrogen), and yellow (sulphur). The crystal pose of the ligand 17-AAG in the cavity sized 3793 is colored white (hydrogen), grey (carbon), and red (oxygen). Note the comparatively lower Vina score for 17-AAG binding to GRP75-NBD compared to that of KMP within the same pocket, suggesting a stronger fit of KMP in the NBD domain of GRP75. e Venn diagram depicting the number of overlapping human proteins that are targeted by both KMP and 17-AAG. The PharmMapper database was used to predict the targets of Kmp and 17-AAG. This mapping predicted a large overlap of targets shared (cut-off z-score: 0.5) by the two compounds, including HSP90A. Both ligands did not target GRP75. See Suppl. Table 1 for the complete list of overlapping targets
Fig. 7
Fig. 7
Kaempferol enhances IP3R and VDAC1 association promoting mitochondrial Ca2+ uptake. a Representative images of proximity ligation assay (PLA) between IP3R and VDAC1 in C9-500 + saline and C9-500 + KMP treated mice, showing a notable increase in the number of puncta in C9-500 + KMP treated animals (One- way ANOVA: F = 100.0, P < 0.0001***, Sidak’s multiple comparison test: WT + saline vs C9-500 + saline, t = 5.303, ***; C9-500 + saline vs C9-500 + KMP, t = 16.31, ***). Scale bar = 10 μm, n = 3–4 mice per genotype/treatment. b Baseline and stimulated mitochondrial Ca2+ uptake traces in WT and C9-500 cortical neurons (dotted lines) and after KMP treatment (bold lines). KMP treatment significantly improves Ca2+ uptake in the mitochondria of C9-500 cortical neurons (number of neurons WT: 22, C9-500: 24, WT + KMP:21, C9-500 + KMP: 21; multiple t-test 100 s C9-500 mean = 0.967, C9-500 + KMP mean = 2.285, P < 0.0001). c Representative confocal images of spinal cord immunolabeled for GRP75 shows a significant increase in C9-500 and WT MNs treated with KMP (One-way ANOVA F = 102.8, P < 0.0001***, Sidak’s multiple comparison test: WT saline vs C9-500 saline t = 6.203, ***; C9-500 saline vs C9-500 + KMP t = 16.42, ***). Scale bars: 30 μm. d List of proteins found to specifically interact with GRP75 in C9-500 ventral spinal cord but not in WT after mass spectroscopy (MS) analysis of immunoprecipitation for GRP75. Specifically, in red are highlighted GRP75 and VDAC1 as an internal control of the experiment (present in both WT and C9-500 samples), and in green is highlighted ATP5J (ATP synthase factor 6 of the mitochondria), whose interaction with GRP75 was detected in C9-500 ventral spinal cord lysates, which are enriched for MNs. e PLA between ATP5J and GRP75 in WT and C9-500 at P125 and P200, showing notable increase in number of puncta in C9-500 at P125 when MNs express high levels of GRP75 (Unpaired t-test P125 WT vs C9-500, t = 25.28, ***; P200 WT vs C9-500, t = 3.58, ***). f Representative confocal images of WT and C9-500 MNs stained for GRP75 and ATP5J. MNs expressing high levels of GRP75 also express high levels of ATP5J. Right: Q.A of ATP5J expression across different disease stages: One-way ANOVA F = 95.75, P < 0.0001***; Sidak’s multiple comparison test: P30 WT n = 26 vs P30 C9-500 n = 46, t = 0.4823, n.s.; P125 WT n = 42 vs P125 C9-500 n = 59, t = 16.29***, P200 WT n = 27 vs P200 C9-500 n = 27, t = 3.795***. Scale bars: 30 μm. g Representative images of ATP5J staining depicting the increased intensity of ATP5J expression in WT and C9-500 treated with KMP (One-way ANOVA: F = 90.48, P < 0.0001***, Sidak’s multiple comparison test: WT saline vs WT + KMP t = 4.928, ***; C9-500 saline vs C9-500 + KMP t = 15.55, ***). Scale bars: 10 μm

Similar articles

Cited by

References

    1. Halliday M, Mallucci GR (2014) Targeting the unfolded protein response in neurodegeneration: a new approach to therapy. Neuropharmacology 76:169–174 - PubMed
    1. Hetz C, Saxena S (2017) ER stress and the unfolded protein response in neurodegeneration. Nat Rev Neurol 13:477–491 - PubMed
    1. Rozpędek-Kamińska W, Siwecka N, Wawrzynkiewicz A, Wojtczak R, Pytel D, Diehl JA et al (2020) The PERK-dependent molecular mechanisms as a novel therapeutic target for neurodegenerative diseases. Int J Mol Sci 21:2108 - PMC - PubMed
    1. Kim S, Kim DK, Jeong S, Lee J (2022) The common cellular events in the neurodegenerative diseases and the associated role of endoplasmic reticulum stress. Int J Mol Sci 23:5894 - PMC - PubMed
    1. Saxena S, Cabuy E, Caroni P (2009) A role for motoneuron subtype-selective ER stress in disease manifestations of FALS mice. Nat Neurosci 12:627–636 - PubMed

Publication types

MeSH terms