. 2025 Feb 1;18(1):8.
doi: 10.1186/s13072-025-00571-z.

Epigene functional diversity: isoform usage, disordered domain content, and variable binding partners

Affiliations

Epigene functional diversity: isoform usage, disordered domain content, and variable binding partners

Leroy Bondhus et al. Epigenetics Chromatin. .

Abstract

Background: Epigenes are defined as proteins that perform post-translational modification of histones or DNA, reading of post-translational modifications, form complexes with epigenetic factors or changing the general structure of chromatin. This specialized group of proteins is responsible for controlling the organization of genomic DNA in a cell-type specific fashion, controlling normal development in a spatial and temporal fashion. Moreover, mutations in epigenes have been implicated as causal in germline pediatric disorders and as driver mutations in cancer. Despite their importance to human disease, to date, there has not been a systematic analysis of the sources of functional diversity for epigenes at large. Epigenes' unique functions that require the assembly of pools within the nucleus suggest that their structure and amino acid composition would have been enriched for features that enable efficient assembly of chromatin and DNA for transcription, splicing, and post-translational modifications.

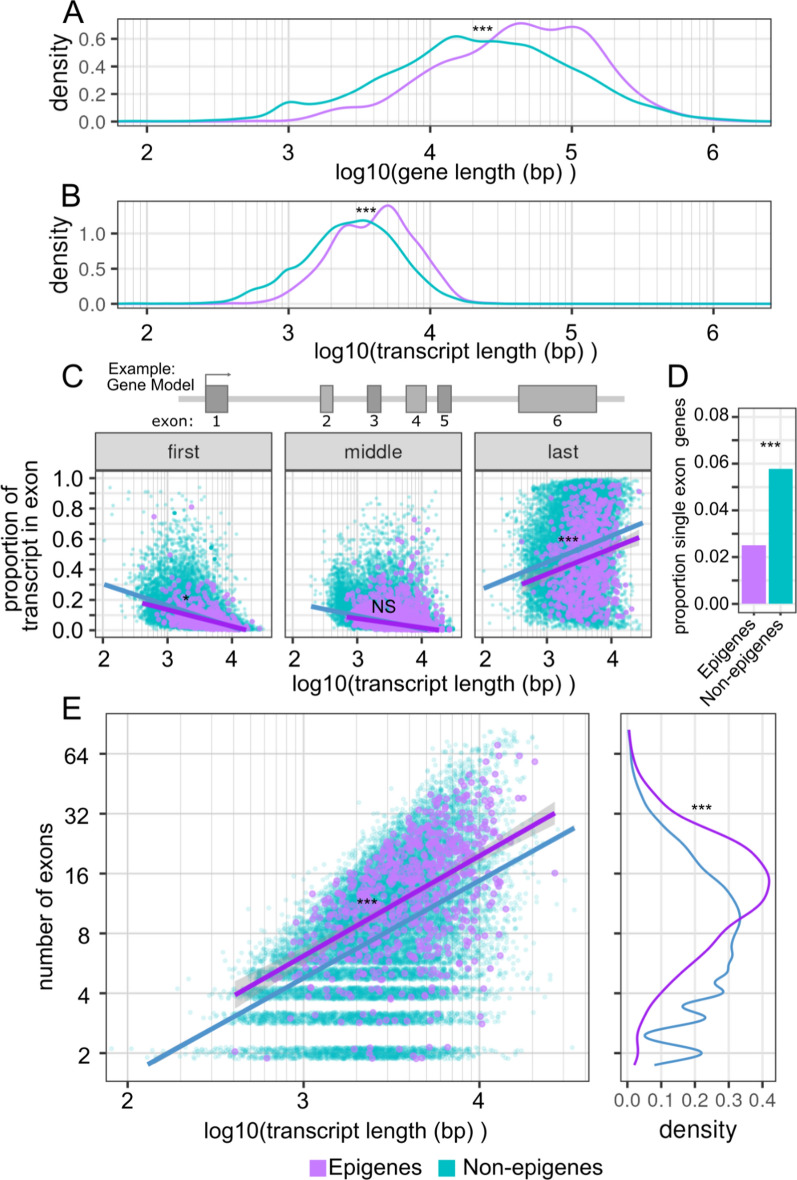
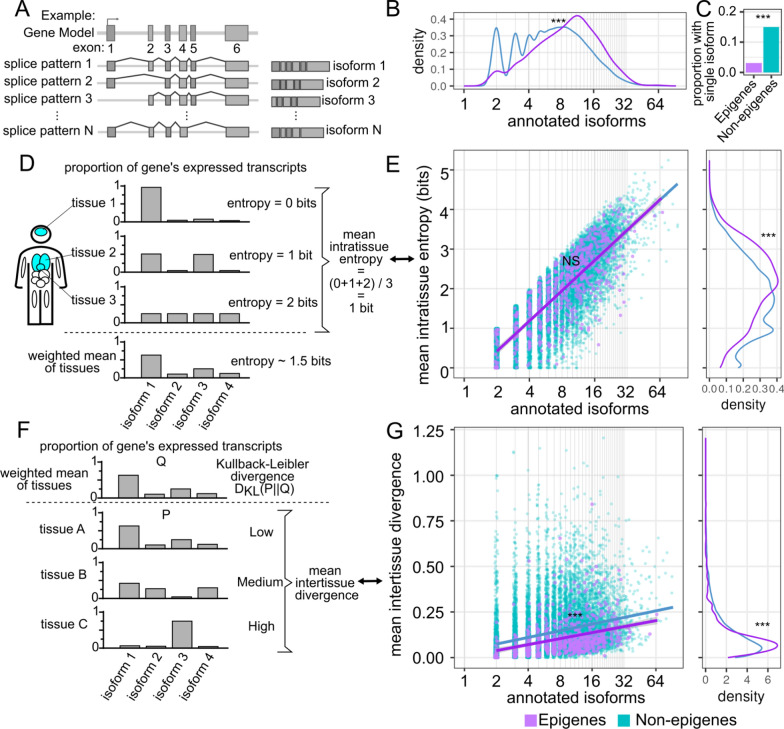
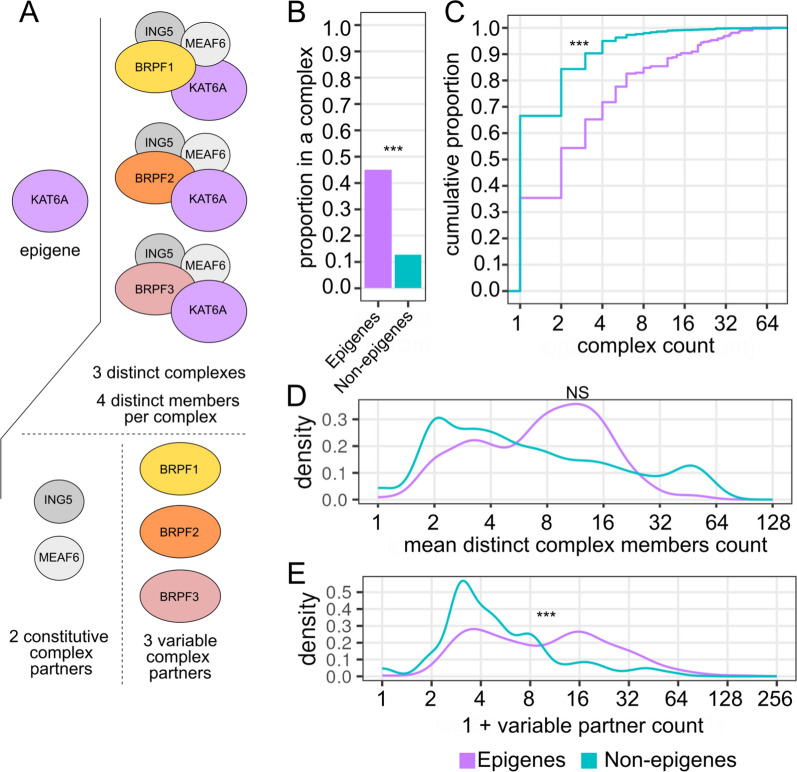
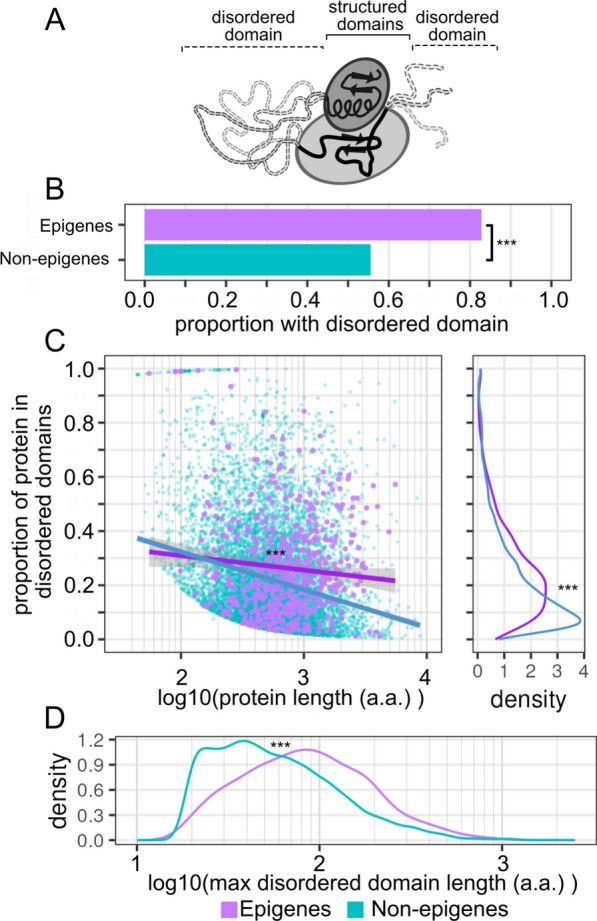
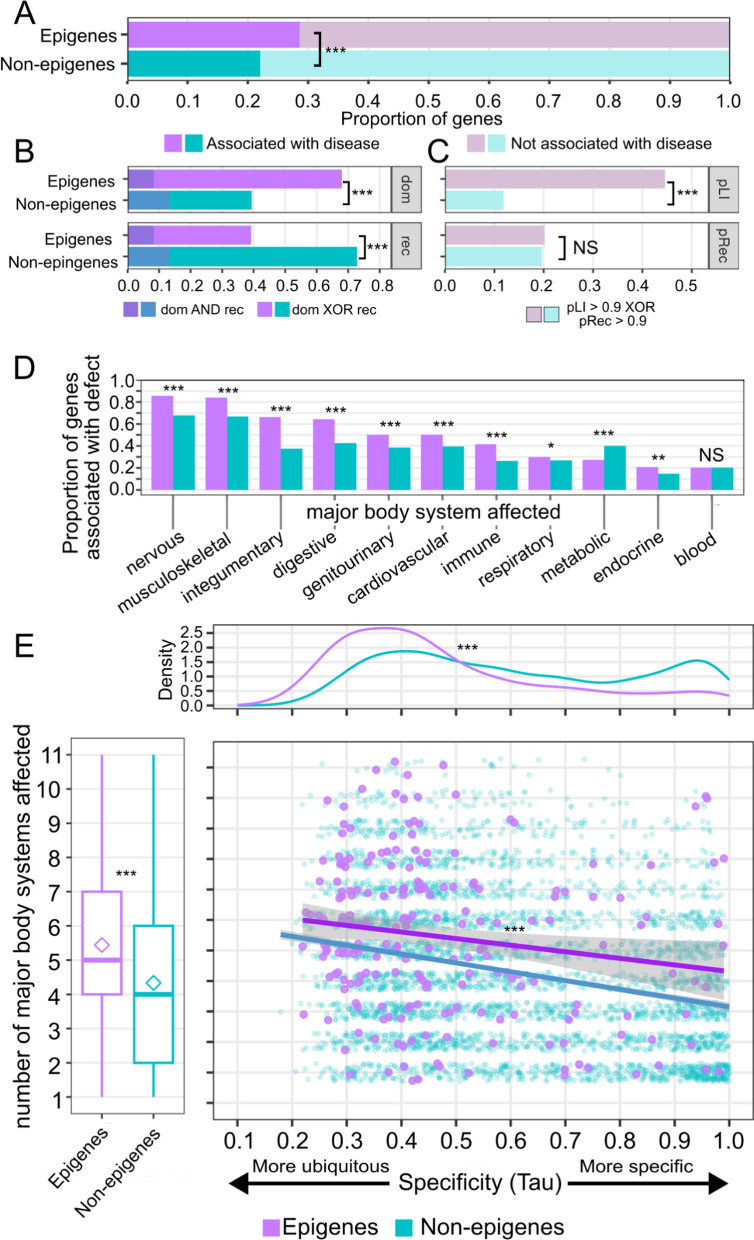
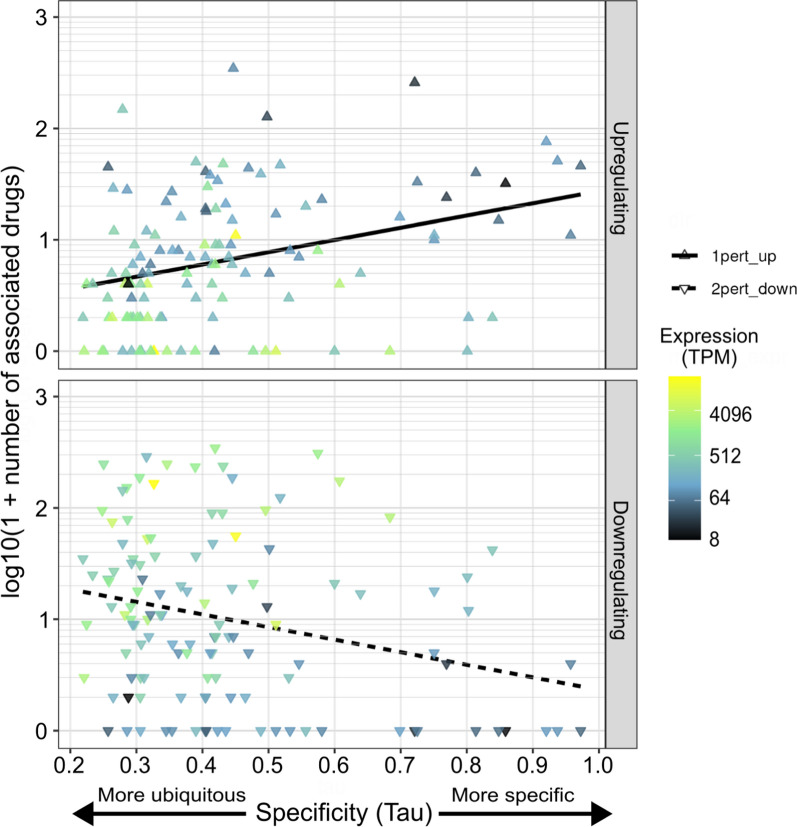
Results: In this study, we assess the functional diversity stemming from gene structure, isoforms, protein domains, and multiprotein complex formation that drive the functions of established epigenes. We found that there are specific structural features that enable epigenes to perform their variable roles depending on the cellular and environmental context. First, epigenes are significantly larger and have more exons compared with non-epigenes which contributes to increased isoform diversity. Second epigenes participate in more multimeric complexes than non-epigenes. Thirdly, given their proposed importance in membraneless organelles, we show epigenes are enriched for substantially larger intrinsically disordered regions (IDRs). Additionally, we assessed the specificity of their expression profiles and showed epigenes are more ubiquitously expressed consistent with their enrichment in pediatric syndromes with intellectual disability, multiorgan dysfunction, and developmental delay. Finally, in the L1000 dataset, we identify drugs that can potentially be used to modulate expression of these genes.

Conclusions: Here we identify significant differences in isoform usage, disordered domain content, and variable binding partners between human epigenes and non-epigenes using various functional genomics datasets from Ensembl, ENCODE, GTEx, HPO, LINCS L1000, and BrainSpan. Our results contribute new knowledge to the growing field focused on developing targeted therapies for diseases caused by epigene mutations, such as chromatinopathies and cancers.

Keywords: Chromatin modifiers; Epigenes; Epigenetics; Rare diseases; Transcriptomics.


Conflict of interest statement

Declarations. Competing Interests: The authors declare no competing interests.

Figures

Fig. 1
Fig. 1
Epigenes are larger and have more exons than other genes. A Density distribution of gene lengths for epigenes and all other genes. B Density distribution of transcript lengths for epigenes and all other genes. C Transcript length plotted against the proportion of the transcript in each exon partitioning by first, middle, and last exons. Each point represents a single exon from a canonical transcript. Regression lines shown for epigene and all other genes groups. Genes encoded by a single exon were excluded. D Proportion of epigenes and other genes that are encoded by single exon genes. E Transcript length against exon count for each gene. Only the canonical transcript is considered. Regression lines shown for epigene and all other gene groups. Single exon genes were excluded. Significance level is indicated by asterisks: NS = not significant, * < 0.05, ** < 0.01, *** < 0.001
Fig. 2
Fig. 2
Epigenes have a greater number of expressed isoforms than other genes but a lower level of tissue specific patterns of relative isoform usage. (A) Toy diagram showing conceptual relation between exons, splice patterns, and isoforms for a single gene. (B) Density plot of the number of annotated isoforms associated with each gene. Single isoform genes were excluded. (C) Proportion of genes for which only a single isoform has been annotated. (D) Toy representation of entropy calculation. For each gene, the isoform proportion estimates are treated as a probability distribution on which entropy is calculated. Given a number of distinct isoforms, entropy is minimized when a single isoform dominates and is maximized as isoform expression proportions become uniform. See methods for precise method of calculation. (E) Number of annotated isoforms against mean intratissue entropy. Regression lines shown for epigene and all other genes groups. Density distribution of the entropy measure is shown to the right of the scatterplot. (F) Toy representation of Kullback-Leibler divergence, DKL(P||Q). For probability distribution P, DKL(P||Q) is minimized when P is equal to distribution Q, and increases as P becomes more dissimilar from Q. Here we define Q for a given gene as the weighted mean of all tissue or biosample isoform proportions. See methods for precise method of calculation. (G) Number of annotated isoforms against mean intertissue divergence as measured by Kullback-Leibler divergence. Regression lines shown for epigene and all other genes groups. Density distribution of the divergence measure is shown to the right of the scatterplot. Significance level is indicated by asterisks: NS not significant, *< 0.05, **< 0.01, ***< 0.001
Fig. 3
Fig. 3
Epigenes have an increased number of variable binding partners compared with non-epigenes. A Toy figure demonstrating how distinct complexes and variable partners are counted. B Proportion of genes associated with some complex. C For genes associated with a protein complex, empirical cumulative density function (eCDF) of the number of variable complex partners for epigenes (purple) and all other genes (teal green). Excluded are all genes not associated with any complex. D Density of mean number of distinct proteins in complexes associated with each gene. For example, in the KAT6A example, there are 3 complexes associated with KAT6A, each of which has 4 distinct proteins, so the mean would be 4 proteins per complex for KAT6A. E Density of number of variable partners associated with each gene, excluding genes associated with one or fewer complexes. Significance level is indicated by asterisks: NS = not significant, * < 0.05, ** < 0.01, *** < 0.001
Fig. 4
Fig. 4
Epigenes are enriched in intrinsically disordered domains. A Toy diagram of disordered vs structured domains. While structured domains are relatively rigid, disordered domains are conformationally labile. B Proportion of genes with at least one disordered domain. C Proportion of protein that is annotated as belonging to a disordered domain. Each point is an individual gene which has at least one annotated disordered region. Regression lines shown for epigene and all other gene groups. Density of proportion of protein in disordered domain shown to the right of the scatterplot. Excludes all genes with no annotated disordered domains. D Density distribution of maximum disordered domain size for each protein with at least one annotated disordered region. Significance level is indicated by asterisks: NS = not significant, * < 0.05, ** < 0.01, *** < 0.001
Fig. 5
Fig. 5
Epigene-associated monogenic disorders are characterized by dominant modes of inheritance and ubiquitous transcript expression profile across multiple body systems. A Proportion of genes associated with at least one mendelian disease. B Of genes associated with some mendelian disease, proportion associated with dominant and recessive modes of inheritance. C Of genes not associated with some mendelian disease, proportion associated with predicted dominant effects, pLI > 0.9, and predicted recessive effects, pRec > 0.9. D Of genes associated with some mendelian disease, proportion associated with some phenotype affecting the major body system indicated. E Center: Scatterplot of specificity of gene expression against number of body systems affected. Regression lines for epigenes and all other genes groups shown. Left margin: boxplot of number of major systems affected by each gene's associated diseases. Mean shown as diamond. Top margin: density distribution of specificity of gene expression. Significance level is indicated by asterisks: NS = not significant, * < 0.05, ** < 0.01, *** < 0.001
Fig. 6
Fig. 6
Drugs can substantially increase and decrease expression for specific epigenes associated with monogenic disorders, here shown for neural progenitor cells. Each point shown in both top and bottom panels is an individual epigene associated with some mendelian disease. Plotted on the x-axis is the gene's overall specificity of expression as measured by Tau, and on the y-axis for the top and bottom panels respectively are the number of drugs with at least a + 3 sd increase and a -3 sd decrease in the gene expression. Points are colored by the gene's overall expression level in the neural progenitor cells

Similar articles

References

    1. Nava AA, Arboleda VA. The omics era: a nexus of untapped potential for Mendelian chromatinopathies. Hum Genet. 2023. 10.1007/s00439-023-02560-2. - PMC - PubMed
    1. Yu X, Zhao H, Wang R, Chen Y, Ouyang X, Li W, et al. Cancer epigenetics: from laboratory studies and clinical trials to precision medicine. Cell Death Discov. 2024;10:28. - PMC - PubMed
    1. Davalos V, Esteller M. Cancer epigenetics in clinical practice. CA Cancer J Clin. 2023;73:376–424. - PubMed
    1. Pan Y, Liu G, Zhou F, Su B, Li Y. DNA methylation profiles in cancer diagnosis and therapeutics. Clin Exp Med. 2018;18:1–14. - PubMed
    1. Berdasco M, Esteller M. Clinical epigenetics: seizing opportunities for translation. Nat Rev Genet. 2019;20:109–27. - PubMed

MeSH terms