. 2025 Jan 2;19(1):wraf016.
doi: 10.1093/ismejo/wraf016.

Life history strategies complement niche partitioning to support the coexistence of closely related Gilliamella species in the bee gut

Affiliations

Life history strategies complement niche partitioning to support the coexistence of closely related Gilliamella species in the bee gut

Chengfeng Yang et al. ISME J. .

Abstract

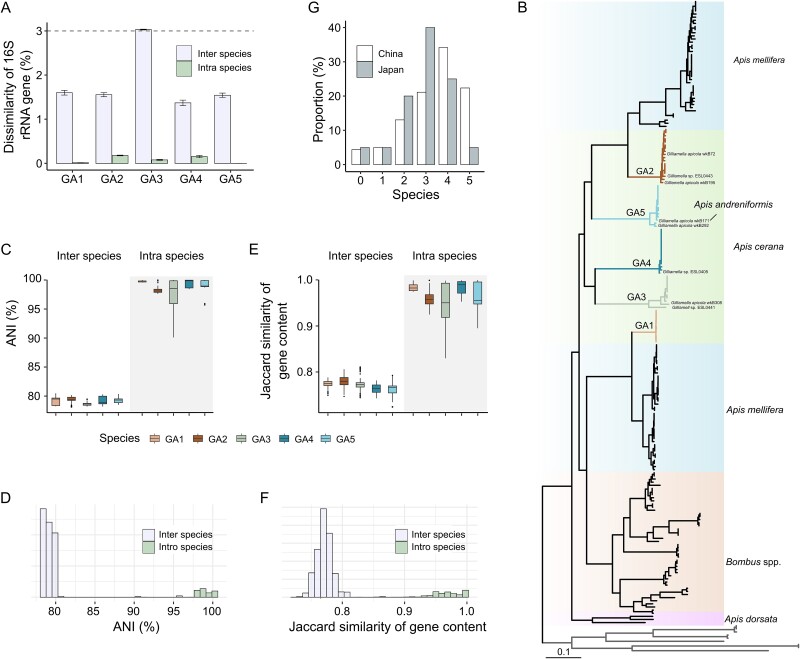
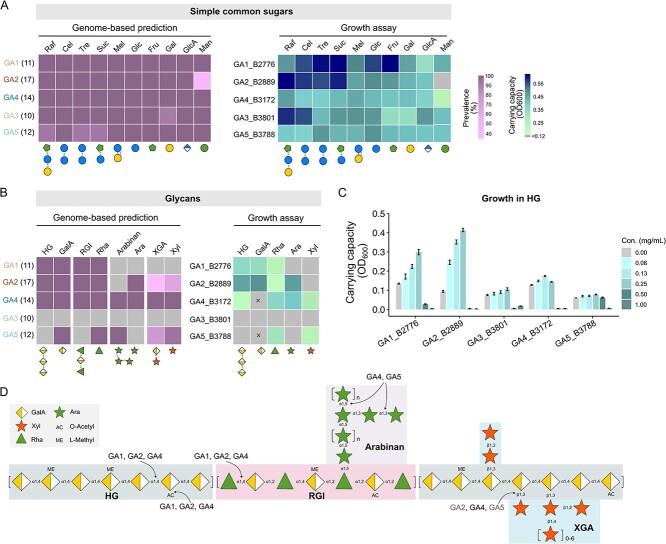
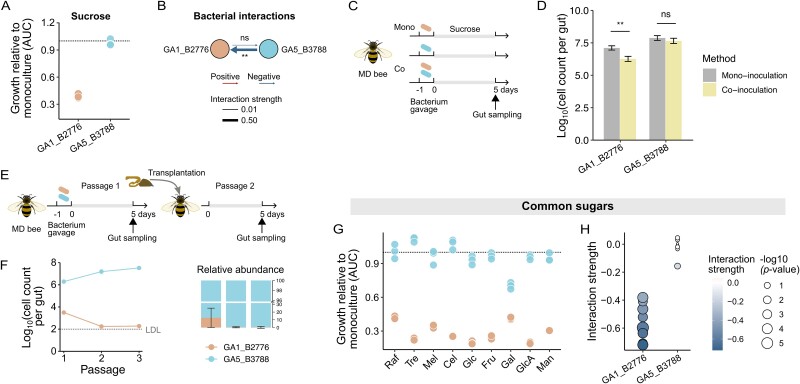
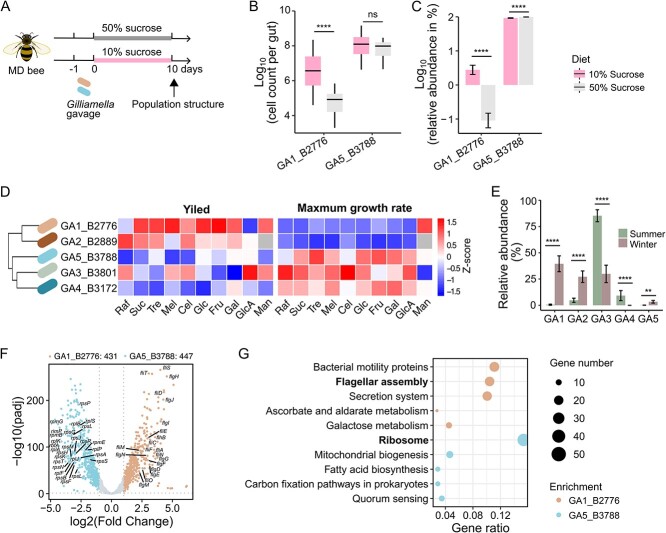
The maintenance of bacterial diversity at both species and strain levels is crucial for the sustainability of honey bee gut microbiota and host health. Periodic or random fluctuation in diet typically alters the metabolic niches available to gut microbes, thereby continuously reshaping bacterial diversity and interspecific interactions. It remains unclear how closely related bacteria adapt to these fluctuations and maintain coexistence within the bee gut. Here, we demonstrate that the five predominant Gilliamella species associated with Apis cerana, a widely distributed Asiatic honey bee, have diverged in carbohydrate metabolism to adapt to distinct nutrient niches driven by dietary fluctuation. Specifically, the glycan-specialists gain improved growth on a pollen-rich diet, but are overall inferior in competition to non-glycan-specialist on either a simple sugar or sugar-pollen diet, when co-inoculated in the bee host and transmitted across generations. Strikingly, despite of their disadvantage in a high-sugar condition, the glycan-specialists are found prevalent in natural A. cerana guts. We further reveal that these bacteria have adopted a life history strategy characterized by high biomass yield on a low-concentration sugar diet, allowing them to thrive under poor nutritional conditions, such as when the bee hosts undergo periodical starvation. Transcriptome analyses indicate that the divergence in life history strategies is attributed to gene expression programming rather than genetic variation. This study highlights the importance of integrative metabolic strategies in carbohydrate utilization, which facilitate the coexistence of closely related Gilliamella species in a changing bee gut environment.

Keywords: r/k selection; gut environmental dynamic; honeybee; interspecific competition; species coexistence.


Conflict of interest statement

The authors declare no competing interests.

Figures

Figure 1
Figure 1
The Gilliamella strains associated with Apis cerana diverge into five species. (A) the dissimilarity of 16S rRNA gene sequence of inter and intro species of GA1–5 (Gilliamella species associated with A. cerana). (B) whole-genome phylogenetic tree of Gilliamella strains derived from Apis dorsata, Bombus spp., A. mellifera, and A. cerana. Nine genomes of the family Orbaceae were selected as outgroups (see methods). (C, D) box plot (C) and histogram (D) show the pairwise average nucleotide identity (ANI) of inter and intro Gilliamella species of GA1–5. (E, F) box plot (E) and histogram (F) depicting the Jaccard similarity coefficient based on pairwise gene content of inter and intro Gilliamella species of GA1–5. (G) percentage of A. cerana individuals across China and Japan harboring multiple Gilliamella species.
Figure 2
Figure 2
Gilliamella species are highly similar in simple sugar metabolism but diverged in glycan utilization. (A, B) the occurrence of common sugar (A) and glycan (B) metabolism genes among strains of each Gilliamella species (GA1–5) (left panel), and the carrying capacity of the type strains of each Gilliamella species cultured in a carbohydrate-free heart infusion agar (cfHIA) medium containing 10 mM of the defined sugar as carbon source (right panel). The bacterial biomass is measured by optical density at 600 nm (OD600) and averaged from three biological replicates. Grey boxes indicate the absence of genes and OD600 < 0.12. Check Dataset S2 for complete carbohydrate utilization gene profiles. Raf, raffinose; Cel, cellobiose; Tre, trehalose; Suc, sucrose; Mel, melibiose; Glc, D-glucose; Fru, D-fructose; gal, D-galactose; GlcA, D-glucuronic acid; man, D-mannose; HG, homogalacturonan; GalA, D-galacturonic acid; RGI, rhamnogalacturonan I; Rha, L-rhamnose; Ara, D-arabinose; XGA, xylogalacturonan; Xyl, D-xylose. (C) the carrying capacity of the representative Gilliamella strains cultured in cfHIA medium with a gradient concentration of HG. (D) the representative constituents of pectic polysaccharides that are potentially accessible to Gilliamella.
Figure 3
Figure 3
Pollen-derived carbon sources promote the growth of glycan degrader strains. (A) schematic illustration of the colonization experiment. Three cup cage replicates were set up for each diet condition. MD, microbiota-depleted. (B, C) the population dynamics of each Gilliamella strain under either the sucrose only (B) or sucrose and pollen (C) diet. Mean values ± SEM (vertical shading) are indicated. n = 5 ~ 6 individual bees from three cup cages for each measurement. (D) the absolute abundance of each Gilliamella strain between two different dietary regimes on Day 10. n = 5 ~ 6 individual bees from three cup cages for each measurement. *P < .05, **P < .01; ns, not significant (Mann–Whitney-Wilcoxon test). (E) cell density measured by fluorescence intensity of GA1_B2776::gfp and GA5_B3788::rfp under a sucrose medium with (right panel) or without (left panel) GalA. Dash line, mono-culture; solid line, co-culture. (F) experimental schematic of the co-colonization of two strains in microbiota-depleted bees. (G) the absolute abundances of strain GA1_B2776 and GA5_B3788 under either dietary conditions. n = 14 individual bees from three cup cages per measurement. *P < .05; ns, not significant (Mann–Whitney-Wilcoxon test). (H) the absolute abundances of the wild-type and GalA-mutant strain of GA1_B2776 on Day 5. n = 9 individual bees from three cup cages for each measurement. GA1_B2776△cgc2, with GalA utilization loci spanning the exuT and uxaCBA genes in CGC2 knocked out. *P < .05; ns, not significant (Mann–Whitney-Wilcoxon test).
Figure 4
Figure 4
Strain GA5_B3788 outcompetes GA1_B2776 on the common sugar substrates. (A) the relative growth of GA1_B2776 and GA5_B3788 in co-culture compared to their mono-culture. Results were depicted as the area under the growth curve (AUC) in co-culture divided by the AUC in mono-culture. Dashed line represents an equal growth. (B) interactions between GA1_B2776 and GA5_B3788 in cfHIA medium with 10 mM sucrose. Arrow thickness represents interaction strength, which is proportional to log10 (AUC [co-culture] / AUC [mono-culture]), Student’s t-tests were used to calculate the significance. (C) schematic illustration of the mono-inoculation and co-inoculation of strain GA1_B2776 and GA5_B3788 in microbiota-depleted bees. (D) the absolute abundances of GA1_B2776 and GA5_B3788 in mono- or co-colonized bees. n = 8 ~ 10 individual bees from three cup cages for each measurement. **P < .01; ns, not significant (Mann–Whitney–Wilcoxon test). (E) schematic of the gut microbiome transplantation experiment. The homogenate of three guts was used to inoculate microbiota-depleted bees of the next generation. (F) the absolute and relative abundances of GA1_B2776 and GA5_B3788 over passages. Mean values ± SEM (vertical shading) are indicated. n = 16 ~ 21 individual bees from three cup cages for each measurement. LDL, limit detection line. (G) the relative growth of GA1_B2776 and GA5_B3788 in co-culture compared to their mono-culture in cfHIA medium supplemented with 10 mM of a defined simple sugar. Raf, raffinose; Cel, cellobiose; Mel, melibiose; Tre, trehalose; Glc, D-glucose; Fru, D-fructose; gal, D-galactose; GlcA, D-glucuronic acid; man, D-mannose. (H) interactions between GA1_B2776 and GA5_B3788 in cfHIA medium supplemented with 10 mM of defined simple sugar.
Figure 5
Figure 5
The divergence in life history strategy allows GA1_B2776 to adapt to a low-sugar condition. (A) schematic illustration of the co-colonization of strain GA1_B2776 and GA5_B3788 in microbiota-depleted bees rearing under either a 10% or a 50% (w/v) sucrose syrup. (B, C) the absolute (B) and relative (C) abundances (%) of GA1_B2776 and GA5_B3788 cultured in a sucrose solution of a high (50% w/v) or low (10% w/v) concentration measured on Day 5. The y-axis indicates the log10 value of the relative abundance of each bacterial strain under a particular sucrose condition, e.g. the value −1 represents a relative abundance of 0.1%. n = 20 ~ 30 individual bees from three cup cage replicates per treatment. ****P < .0001; ns, not significant (Mann–Whitney-Wilcoxon test). (D) Dendrogram clustering of the Gilliamella type strains based on the bacterial growth traits (carrying capacity and growth rates) across all common sugar substrates. (E) relative abundance of Gilliamella species in wild bees collected in summer or winter. Bars show the mean relative abundance (%) of each strain. Error bars show ± SEM. n = 24 bees per season. **P < .01, ****P < .0001 (Mann–Whitney-Wilcoxon test). (F) volcano plots showing adjusted P value (padj) versus gene expression fold changes between GA1_B2776 and GA5_B3788 revealed in transcriptome analysis. Genes involved in ribosome and flagellar assembly with log2(fold change) > = 2 and -log10(padj) > 50 are marked. (G) KEGG pathways significantly enriched from featured genes of GA1_B2776 and GA5_B3788. Padj < .05, fisher test, Benjamini-Hochberg adjustment.

Similar articles

References

    1. Kwong WK, Medina LA, Koch H et al. Dynamic microbiome evolution in social bees. Sci Adv 2017;3:e1600513. 10.1126/sciadv.1600513 - DOI - PMC - PubMed
    1. Ellegaard KM, Engel P. Genomic diversity landscape of the honey bee gut microbiota. Nat Commun 2019;10:446. 10.1038/s41467-019-08303-0 - DOI - PMC - PubMed
    1. Su Q, Wang Q, Mu X et al. Strain-level analysis reveals the vertical microbial transmission during the life cycle of bumblebee. Microbiome 2021;9:216. 10.1186/s40168-021-01163-1 - DOI - PMC - PubMed
    1. Su Q, Tang M, Hu J et al. Significant compositional and functional variation reveals the patterns of gut microbiota evolution among the widespread Asian honeybee populations. Front Microbiol 2022;13:934459–9. 10.3389/fmicb.2022.934459 - DOI - PMC - PubMed
    1. Ellegaard KM, Tamarit D, Javelind E et al. Extensive intra-phylotype diversity in lactobacilli and bifidobacteria from the honeybee gut. BMC Genomics 2015;16:284. 10.1186/s12864-015-1476-6 - DOI - PMC - PubMed

Substances

LinkOut - more resources