. 2025 Apr 1:309:121045.
doi: 10.1016/j.neuroimage.2025.121045. Epub 2025 Feb 1.

Deep-ER: Deep Learning ECCENTRIC Reconstruction for fast high-resolution neurometabolic imaging

Affiliations

Deep-ER: Deep Learning ECCENTRIC Reconstruction for fast high-resolution neurometabolic imaging

Paul J Weiser et al. Neuroimage. .

Abstract

Introduction: Altered neurometabolism is an important pathological mechanism in many neurological diseases and brain cancer, which can be mapped non-invasively by Magnetic Resonance Spectroscopic Imaging (MRSI). Advanced MRSI using non-cartesian compressed-sense acquisition enables fast high-resolution metabolic imaging but has lengthy reconstruction times that limits throughput and needs expert user interaction. Here, we present a robust and efficient Deep Learning reconstruction embedded in a physical model within an end-to-end automated processing pipeline to obtain high-quality metabolic maps.

Methods: Fast high-resolution whole-brain metabolic imaging was performed at 3.4 mm3 isotropic resolution with acquisition times between 4:11-9:21 min:s using ECCENTRIC pulse sequence on a 7T MRI scanner. Data were acquired in a high-resolution phantom and 27 human participants, including 22 healthy volunteers and 5 glioma patients. A deep neural network using recurring interlaced convolutional layers with joint dual-space feature representation was developed for deep learning ECCENTRIC reconstruction (Deep-ER). 21 subjects were used for training and 6 subjects for testing. Deep-ER performance was compared to iterative compressed sensing Total Generalized Variation reconstruction using image and spectral quality metrics.

Results: Deep-ER demonstrated 600-fold faster reconstruction than conventional methods, providing improved spatial-spectral quality and metabolite quantification with 12%-45% (P<0.05) higher signal-to-noise and 8%-50% (P<0.05) smaller Cramer-Rao lower bounds. Metabolic images clearly visualize glioma tumor heterogeneity and boundary. Deep-ER generalizes reliably to unseen data.

Conclusion: Deep-ER provides efficient and robust reconstruction for sparse-sampled MRSI. The accelerated acquisition-reconstruction MRSI is compatible with high-throughput imaging workflow. It is expected that such improved performance will facilitate basic and clinical MRSI applications for neuroscience and precision medicine.

Keywords: Brain; Compressed sensing; Deep learning; Glioma; Image reconstruction; MR spectroscopic imaging; Metabolism; Non-cartesian; Ultra high field.


Conflict of interest statement

Declaration of competing interest The authors declare that they have no known competing financial interests or personal relationships that could have appeared to influence the work reported in this paper.

Figures
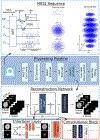
Fig. 1.
Fig. 1.
Deep-learning ECCENTRIC reconstruction (Deep-ER), fully compatible with non-Cartesian compressed-sensing MRSI acquisition over the whole brain. Top: ECCENTRIC pulse sequence with ultra-short TE excitation and gradient waveforms for eccentric circles, showing full sampling (AF=1) and twice accelerated compressed-sense undersampling (AF=2), as well as the 3D spherical stack of phase-encoded partitions. Middle: Processing pipeline diagram. Bottom: Deep-learning image reconstruction using 10 fully convolutional Interlacer layers. Each layer processes image and k-space features in parallel, mixing them back together by a learned linear combination after taking the appropriate Fourier transform. The output of each layer is added back to the input. The network reconstructs each 3D time-point of MRSI data separately to maintain independence of the specific acquisition parameters of the MRSI sequence.
Fig. 2.
Fig. 2.
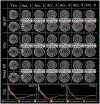
Comparison of reconstruction methods for water images acquired with ECCENTRIC in human brain for accelerations 1 to 6. The top images present the data reconstructed only with the inverse non-uniform FFT (iNUFT). The center images show the reconstruction performed by conventional compressed sense reconstruction (TGV) and the bottom slices show reconstruction by Interlacer (Deep-ER). The images reconstructed for the first FID time point of ECCENTRIC are shown for each reconstruction method. The corresponding ground truth T1-weighted image is shown to the left. Two different slices are presented for each reconstruction method. NRMSE and SSIM were computed for each acceleration between the T1-weighted image and the ECCENTRIC reconstructions. At the bottom examples of FIDs time-series overlaid for all accelerations are shown for all three methods.
Fig. 3.
Fig. 3.
Phantom metabolic images of Creatine reconstructed by Deep-ER and TGV-ER for accelerations from 1 to 5. Correlation coefficients (CC) indicate the agreement between Creatine images reconstructed by the 2 methods. Representative spectra from voxels indicated by arrows are presented at the bottom. Spectra for all accelerations are shown overlaid for each method from the tubes of 10 mm (I), 8 mm (II), 6 mm (III) and 4 mm (IV) diameter. The 2 mm tubes are not individually resolved by the 3.4 mm ECCENTRIC resolution.
Fig. 4.
Fig. 4.
Metabolic images in a glioma patient (top, Patient #1 in Table 1) and a healthy volunteer (bottom). The deep learning Deep-ER reconstruction (left) is compared to the conventional TGV-ER reconstruction (right) showing metabolic maps (NAA, Choline, Creatine, Glutamate and Glutamine), maps of SNR and Cramer–Rao Lower Bounds (NAA and Choline). Example of spectra from individual voxels indicated by red arrows on the anatomical images are shown at the bottom (white trace shows measured spectrum, red trace shows LCModel fit).
Fig. 5.
Fig. 5.
Quantitative comparison of metabolic maps across acceleration factors. Left: Bland-Altman plots are computed for acceleration 2 to 5 for the reconstructed metabolic maps (NAA+NAAG, Cr+PCr, GPC+PCh, Glu+Gln and Ins+Gly). Right: Boxplots of FWHM, SNR and CRLB of total NAA, Choline and Creatine as computed by LCModel. Each plot compares the deep learning based approach Deep-ER to conventional TGV-ER reconstruction across accelerations 2 to 5. Statistical significant differences are indicated by the * symbol.

References

    1. Aggarwal Hemant K., Mani Merry P., Jacob Mathews, 2018. MoDL: Model-based deep learning architecture for inverse problems. IEEE Trans. Med. Imaging 38 (2), 394–405. - PMC - PubMed
    1. Bagchi Sonali, Mitra Sanjit K., 1996. The nonuniform discrete Fourier transform and its applications in filter design. I. 1-D. IEEE Trans. Circuits Syst. II 43 (6), 422–433.
    1. Bilgic Berkin, Chatnuntawech Itthi, Fan Audrey P., Setsompop Kawin, Cauley Stephen F., Wald Lawrence L., Adalsteinsson Elfar, 2014. Fast image reconstruction with L2-regularization. J. Magn. Reson. Imaging 40 (1), 181–191. - PMC - PubMed
    1. Bogner Wolfgang, Gruber Stephan, Trattnig Siegfried, Chmelik Marek, 2012. High-resolution mapping of human brain metabolites by free induction decay 1H MRSI at 7 T. NMR Biomed. 25 (6), 873–882. - PubMed
    1. Bogner W, Hess AT, Gagoski B, Tisdall MD, van der Kouwe AJ, Trattnig S, Rosen B, Andronesi OC, 2013. Real-time motion- and B-correction for LASER-localized spiral-accelerated 3D-MRSI of the brain at 3T. Neuroimage 88C, 22–31. - PMC - PubMed