. 2025 Feb 2;22(1):31.
doi: 10.1186/s12974-024-03318-x.

CCL21-CCR7 blockade prevents neuroinflammation and degeneration in Parkinson's disease models

Affiliations

CCL21-CCR7 blockade prevents neuroinflammation and degeneration in Parkinson's disease models

Felipe Saceanu Leser et al. J Neuroinflammation. .

Abstract

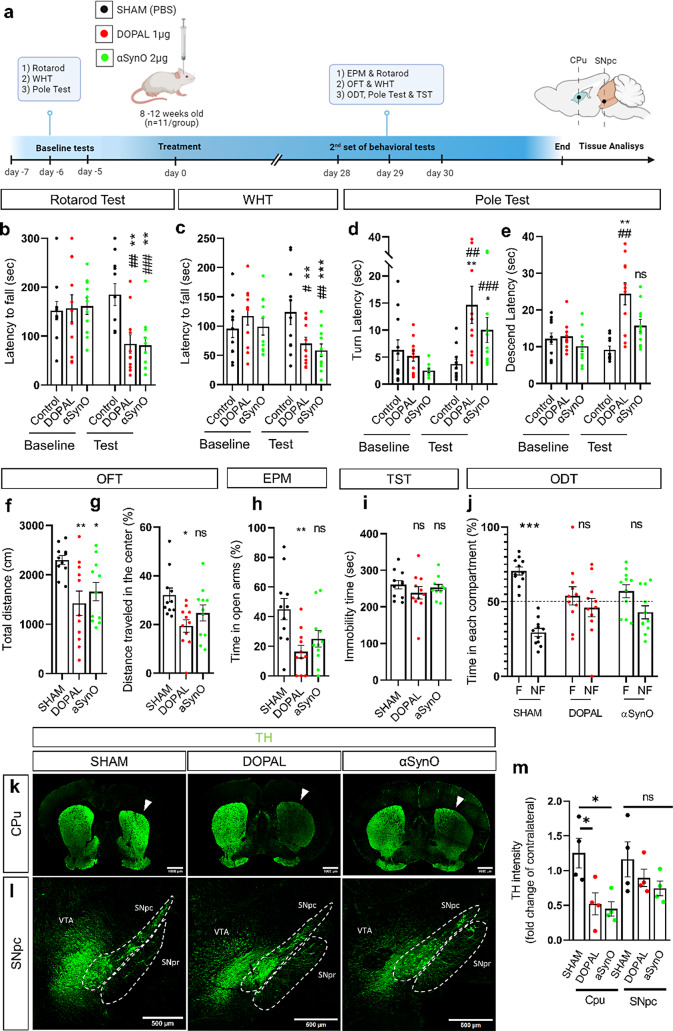
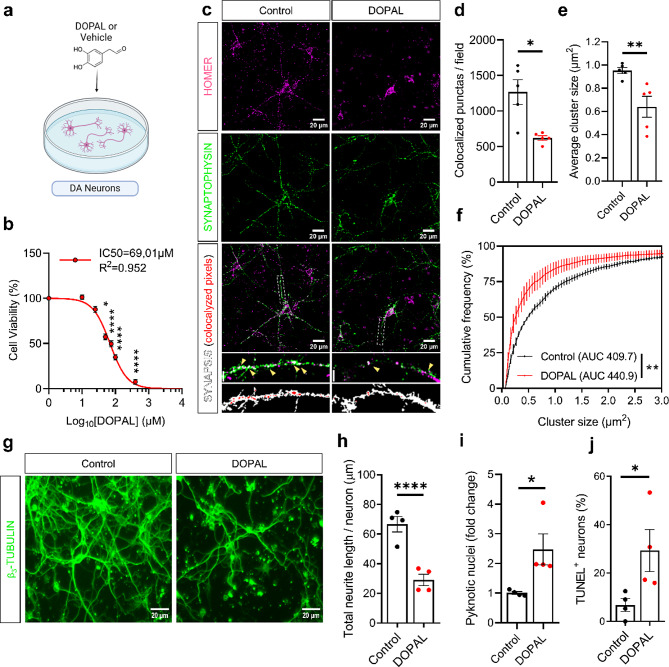
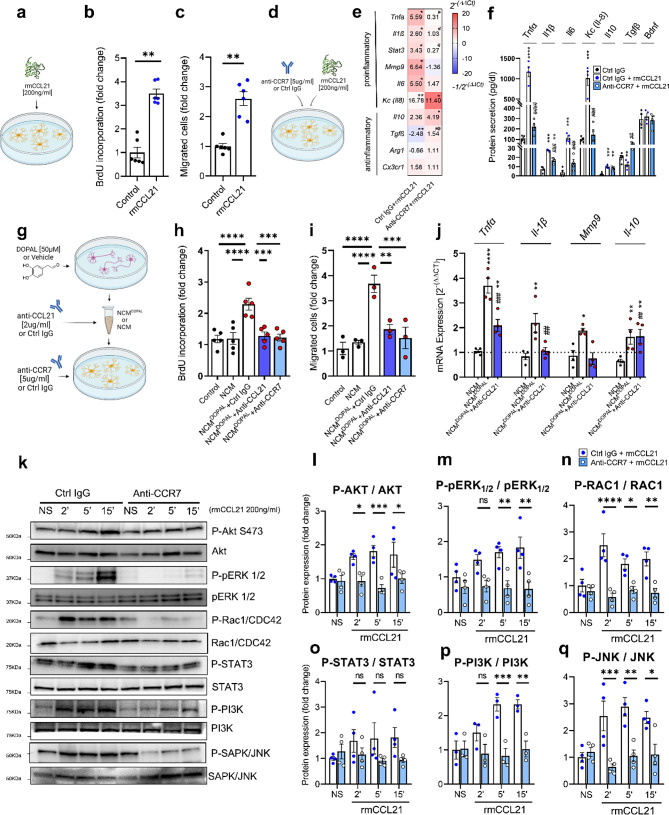
Parkinson's disease (PD) is a progressive degenerative disease of the central nervous system associated with neuroinflammation and microglial cell activation. Chemokine signaling regulates neuron-glia communication and triggers a microglial inflammatory profile. Herein, we identified the neuronal chemokine CCL21 as a major cause of microglial cell imbalance through the CCR7 receptor pathway with therapeutic implications for PD. In humans, we found that CCL21 transcript expression was increased in dopaminergic neurons (DANs) of the substantia nigra in PD patients. CCL21 and CCR7 expressions were spatially associated with brain regional vulnerability to synucleinopathies, as well as with the expression of microglial activation, neuroinflammation, and degeneration-related genes. Also, in mouse models of PD, we showed that CCL21 was overexpressed in DANs in vivo and in vitro. Mechanistically, neuronal CCL21 was shown to regulate microglial cell migration, proliferation, and activation in a CCR7-dependent manner through both canonical (PI3K/AKT) and non-canonical (ERK1/2/JNK) signaling pathways. Finally, we demonstrated that navarixin, a clinically relevant chemokine inhibitor with high affinity for the CCR7 receptor, could block CCL21 effects on microglia and prevent neurodegeneration and behavioral deficits in two mouse models of PD induced with either α-synuclein oligomers (αSynO) or 3,4-dihydroxyphenylacetaldehyde (DOPAL). Altogether, our data indicate that navarixin blocks CCL21/CCR7-mediated neuron-microglia communication and could be used as a therapeutic strategy against PD.

Keywords: CCL21-CCR7 pathway; Chemokine signaling; DOPAL; Microglia; Navarixin; Neuroinflammation; Parkinson`s disease.


Conflict of interest statement

Declarations. Ethical approval: All in vivo experiments were conducted following the Brazilian Experimental Animal Use Guidelines. This study was approved by the Ethics Committee of the Health Sciences Center of the Federal University of Rio de Janeiro (UFRJ) (Protocol number A6/19-001-16 and 025/15). Consent for publication: Not applicable. Clinical trial number: Not applicable. Competing interests: The authors declare no competing interests.

Figures

Fig. 1
Fig. 1
DOPAL induce PD-like deficit in mice. a: Schematics of the experimental design. Mice underwent baseline motor tests seven days prior to surgery. On day 0, mice received intrastriatal injections of vehicle (SHAM), 1 µg DOPAL, or 2 µg αSynO. Subsequently, mice underwent a new set of motor and non-motor behavioral tests at 28–30 days post-injection (dpi), followed by brain collection for histological analysis of the Caudate-Putamen nucleus (Cpu) of the dorsal striatum and Substantia Nigra pars compacta (SNpc). b-e: Quantification of motor test performance at 28-30dpi. Latency time to fall in the rotarod test (b) and in wire hanging test (WHT, c) and latency time to turn to vertical position (d) and to descend to the lower platform in pole test (e). f: Open field test (OFT) assessment of mice general motility and thigmotactic behavior at 29dpi. Quantification of the distance traveled within the entire field (f) and in the center of the field (g). h: Assessment of mice anxiety-like behavior on the elevated plus maze (EPM) at 28dpi. Quantification of time spent in open arms. i: Analysis of mice depressive-like behavior at the tail suspension test (TST) at 30dpi. Total immobility time. j: Quantification of the time spent in each compartment during the olfactory discrimination test (ODT) at 30dpi, distinguishing between familiar (F) and non-familiar (NF) odors. Statistical comparison with SHAM group in motor and non-motor test: One-Way ANOVA test with Tukey’s multiple comparisons test (n = 11/group from 3 independent experiments). ns: not-significant. *p < 0.05; **p < 0.01; ***p < 0.001; ****p < 0.0001. Statistical comparison with baseline values from same group of mice in motor tests: Friedman`s paired test with multiple comparisons. #p < 0.05; ## p < 0.01; ### p < 0.001; #### p < 0.0001. For ODT statistical analysis: Two-way ANOVA with Dunnett`s multiple comparison test against the reference value of 50% staying on each compartment. k-l: Representative image of immunohistochemistry for Tyrosine Hydroxylase (TH), in the CPu (k) and in the SNpc (l). White arrows indicate injection side. The white dashed lines delineate the anatomical structures of the Substantia Nigra pars compacta (SNpc), Substantia Nigra pars reticulata (SNpr), and the Ventral Tegmental Area (VTA). m: Quantification of TH intensity in the CPu and SNpc ipsilateral to the injection, normalized by intensity of the contralateral side. One-Way ANOVA test with Tukey’s multiple comparisons test (n = 4 mice/group from 3 independent experiments). ns: not-significant. *p < 0.05; **p < 0.01; ***p < 0.001; ****p < 0.0001. All data are presented as mean ± SEM
Fig. 2
Fig. 2
DOPAL induces microglia reactive morphology in vivo. a: Quantification of Iba1-positive microglial cells on histological sections of the Cpu on the ipsilateral side of the injection in both SHAM and DOPAL or αSynO-induced models. One-Way ANOVA test with Tukey’s multiple comparisons test (n = 4/group from 4 independent experiments). Data are presented as mean ± SEM. b: Representative image of the semi-automatic analysis steps of microglial cell morphology. This analysis involves IHQ confocal image processing to identify and outline a single Iba1-positive microglial cell, selection and assessment of cell silhouette, skeletonization, skeleton analysis, followed by Sholl’s analysis. c: Representative image depicting the cellular silhouette and skeletonized structure of Iba1-positive microglial cells in the Cpu of mice treated with vehicle (SHAM), DOPAL, or αSynO on both the ipsilateral and contralateral sides of the treatment. d-i: Quantification of morphometric variables of Cpu microglial cells of mice treated with vehicle (SHAM), DOPAL, or αSynO on ipsilateral and contralateral sides of the treatment. Assessment of cell perimeter (d), cell area (e), circularity (f), branch length (g), number of branches (h), number of junctions (i). Data shown as truncated violin plot. Two-tailed Ordinary One Way ANOVA with Tukey`s multiple comparisons test (n = 50 cells/group from 4 independent experiments). j-k: Sholl`s analysis of Cpu microglial cells from ipsilateral and contralateral Cpu of mice treated with vehicle (SHAM), DOPAL or αSynO. Intersection profile of the skeletonized microglial branches with the concentric circles at a given distance from the soma (1 μm step size). Data are represented as mean + SEM and sixth order polynomial regression curve. Only data from ipsilateral side are shown (j). Sum of intersections at all distances from the soma. Data shown as truncated violin plot (k). Two-tailed Ordinary One Way ANOVA with Tukey`s multiple comparisons test (n = 50 cells/group from 4 independent experiments). *p < 0.05; **p < 0.01; ***p < 0.001; ****p < 0.0001. l-m: Distribution and classification of Cpu microglial cells according to morphological parameters on the principal components (PC) plane. Each cell is color-coded according to its treatment group (l) and cluster allocation (m). n: Quantification of the distribution of microglial cells across morphological clusters in the ipsilateral and contralateral Cpu regions of mice treated with vehicle (SHAM), DOPAL, or αSynO. Chi-square test. ****p < 0.0001 (n = 50 cells/group from 4 independent experiments)
Fig. 3
Fig. 3
DOPAL induces neurodegeneration in vitro. a: Schematic representation of the treatment of primary dopaminergic neurons (DAN) with DOPAL or Vehicle (saline) for 24 h. b: MTT cellular viability assay in DAN treated with increasing concentrations of DOPAL (10–400µM). One-Way ANOVA test with Tukey’s multiple comparisons test. R2 represents the Goodness of Fit of the non-linear regression. c: Representative image of immunocytochemistry showing the labeling pre- and postsynaptic markers, Synaptophysin and Homer in DAN treated with DOPAL. Arrows (yellow) indicate the colocalized synaptic puncta (white). In high-magnification images of synaptic puncta, the scale bar corresponds to 5 μm. (n = 5/group from 5 independent experiments). d to f: Quantification of the total number (d), average size (e) and cumulative frequency of size distribution (f) of colocalized synaptic puncta. Two-tailed Mann-Whitney Test (n = 5/group from 5 independent experiments). g: Immunocytochemistry of β3-tubulin in DAN treated with DOPAL. h: Sum of β3tubulin-positive neurites length per neuron. Two-tailed Mann-Whitney Test (n = 4/group from 4 independent experiments). i-j: Number of pyknotic (i) and TUNEL positive (j) nuclei of apoptotic DAN treated with DOPAL. Two-tailed Mann-Whitney Test (n = 4/group from 4 independent experiments). Data expressed as mean ± standard error (SEM). ns: not-significant; *p < 0.05; **p < 0.01; ***p < 0.001; ****p < 0.0001
Fig. 4
Fig. 4
CCL21 expression is increased in SNpc DANs and is a candidate neuroinflammatory marker in PD patients and mouse models. a: Expression of CCL21 and in SNpc neurons of age-matched control (black, n = 8) and PD patients (red, n = 10). GSE20141 Dataset. Mann-Whitney Test. Data expressed as mean ± SEM. b: Scheme of classification of brain regions by the progression of PD in R1 to R6 according to Braak stages, corresponding to regions from highest to lowest vulnerability to synucleinopathies. c and d: Representative heatmap of expression of CCL21 (c) and CCR7 (d) in each brain region represented in a coronal section (AHBA reference brain atlas). Values normalized by z-score. e and f: Expression of CCL21 (e) and CCR7 (f) in brain regions involved in each Braak stage. Results are presented as average of six healthy donors. Each dot represents one brain region. All data are shown as boxes of Median ± Interquartile range and bars of 95%CI. g: Main enriched biological processes Gene Ontology Terms among genes positively correlated with CCL21. h to j: Volcano plot of genes positively correlated with CCL21 sorted by its biological functions of interest as genes related with microglial cell reactivity (h), neuroinflammation (i) and degeneration (j). k-l: Representative immunohistochemical images (k) and quantification (l) of Tyrosine Hydroxylase (TH) and CCL21 chemokine expression in the Substantia Nigra pars compacta (SNpc) of mice treated with either vehicle (PBS, control) or DOPAL. Two-tailed Mann-Whitney Test (n = 4 mice/group from 3 independent experiments). m-n: Representative image (m) and quantification (n) of CCL21 chemokine expression via immunocytochemistry in primary DAN following treatment with 50µM DOPAL or vehicle (PBS, control) for 24 h. Two-tailed Mann-Whitney Test (n = 6 mice/group from 6 independent experiments). o-p: Western blot analysis labeling CCL21 in primary DAN treated with vehicle (PBS, control) or 50µM of DOPAL for 24 h. Two-tailed Mann-Whitney Test (n = 4 mice/group from 4 independent experiments). Data expressed as mean ± SEM. *p < 0.05; **p < 0.01; ***p < 0.001; ****p < 0.0001
Fig. 5
Fig. 5
Neuron Conditioned Medium (NCM) induces microglia reactivity, migration and proliferation through CCL21/CCR7 pathway. a: Schematics of the treatment of primary microglia with 200ng/mL of recombinant mouse CCL21 protein (rmCCL21) for 24 h. b-c: BrdU incorporation (b) and Boyden transwell chamber migration (c) assays of primary microglial cells treated with saline (control) or rmCCL21. Two-tailed Mann-Whitney Test (n = 6/group from 6 independent experiments). d: Schematics of the treatment of primary microglia with either Control IgG or 5ug/ml of Anti-CCR7 bAb for 30 min followed by stimulation with 200ng/mL rmCCL21 for 24 h. Microglial mRNA was extracted for RT-qPCR analysis, while the conditioned medium (MCM) was collected for quantifying cytokine secretion using ELISA. e: RNA expression levels on RT-qPCR of proinflammatory factors (Tnfα, Il-1β, Mmp9, Stat3, Il6 and Il8) and anti-inflammatory factors and microglial homeostatic state markers (Il10, Tgfβ, Arg1, Cx3cr1). In the heatmap indicates mRNA expression levels. Zero value (white) represent the normalized average expression in Ctrl IgG treated controls, hot colors (red gradient) represent positively regulated genes [2-(ΔΔCt)] and cold colors (blue gradient) represent negatively regulated genes [-1/2-(ΔΔCt)]. One-Way ANOVA test with Tukey’s multiple comparisons test (Tnfα = 4, Il-1β = 4, Stat3 = 3, Mmp9 = 3, Il6 = 3, Il8 = 3, Il10 = 4, Tgfβ = 4, Arg1 = 3, Cx3cr1 = 3 from independent experiments). f: Quantification of cytokine secretion in microglial conditioned medium (MCM) using ELISA. One-Way ANOVA test with Tukey’s multiple comparisons test (n = 4/group from 4 independent experiments). ns: not-significant; *p < 0.05; **p < 0.01; ***p < 0.001; ****p < 0.0001 versus Control IgG; #p < 0.05; ## p < 0.01; ### p < 0.001; #### p < 0.0001 versus Control IgG + rmCCL21. g: Experiment schematic depicting the collection of conditioned medium from DAN treated with vehicle (PBS, NCM) or 50 μm DOPAL (NCMDOPAL). Primary microglial cells were then exposed to NCM or NCMDOPAL. Thirty minutes before this exposure, NCMDOPAL was pre-incubated with anti-CCL21 bAb (2 µg/mL) blocking antibodies (bAb) or control IgG, while the microglial cells were pre-treated with anti-CCR7 bAb (5 µg/mL) or control IgG. h-i: Assessment of cell proliferation and migration via BrdU incorporation (h) and Boyden chamber transwell assay (i) in primary microglial cells treated with NCM or NCMDOPAL, in conjunction with anti-CCL21 or anti-CCR7 bAb, or Control IgG. One-Way ANOVA test with Tukey’s multiple comparisons test (n = 5/group and 3/group from 5 and 3 independent experiments). j: RT-qPCR expression analysis of proinflammatory chemokines Il-1β, Tnfα, Mmp9 and anti-inflammatory Il-10 in microglial cells treated with NCM or NCMDOPAL, along with anti-CCL21 bAb, or Control IgG. One-Way ANOVA test with Tukey’s multiple comparisons test (n = 4/group from 4 independent experiments). Data are presented as mean ± SEM. ns: not-significant; *p < 0.05; **p < 0.01; ***p < 0.001; ****p < 0.0001 versus non-stimulated control (black dashed line); #p < 0.05; ## p < 0.01; ### p < 0.001; #### p < 0.0001 versus NCM. k-q: Western blot analysis of CCL21 downstream signaling pathway in EOC20 microglial cell line treated with Control IgG or Anti-CCR7 bAb and stimulated with of rmCCL21 treatment for 0(NS), 2 min, 5–15 min. Representative image (k) and quantification of P-AKT/AKT (l); P-pERK1/2/pERK1/2 (m); P-RAC1/RAC1 (n); P-STAT3/STAT3 (o); P-PI3K / PI3K (p); P-JNK / JNK (q). Data are presented as mean ± SEM. Two-Way ANOVA test with Sidak’s multiple comparisons test (n = 4/group from 4 independent experiments)
Fig. 6
Fig. 6
Navarixin has a good docking profile to CCR7 receptor, inhibits CCL21 effect on microglial cells and induces neuroprotection in neuron-microglia coculture. a: Navarixin (blue) docking to CCR7 receptor (white) intracellular binding pocket. b-c: CCR7 residues interacting with Navarixin through polar or non-polar (electrostatic) contacts (b) in the best docking model (c). d-e: Navarixin dose titration for inhibition of CCL21 effect on primary microglial cells. Assessment of microglial cell proliferation and migration via BrdU incorporation (d) and Boyden chamber transwell assay (e) after treatment with increasing concentrations of Navarixin and further stimulation with rmCCL21. One-Way ANOVA test with Tukey’s multiple comparisons test (n = 5/group for BrdU assay; n = 4/group for transwell assay from 5 and 4 independent experiments, respectively). Red line represents non-linear fit ([inhibitor] vs. normalized response – Variable Slope). Black dashed line shows predicted IC50. f: Schematics of indirect cocultures of DAN and primary microglia. Cocultures were preincubated with Control IgG, Anti-CCL21, Anti-CCR7 bAb or Navarixin (100 μm) during 30 min and treated the cells with either DOPAL or αSynO for 24 h. g-i: Quantification of the number of colocalized synaptic puncta (g), neurites length (h) and TUNEL-positive nuclei (i) of cocultured DAN. One-Way ANOVA test with Tukey’s multiple comparisons test (n = 4/group for Anti-CCL21 and Anti-CCR7; n = 3/group for Navarixin from 4 independent experiments). ns: not-significant; Data are presented as mean ± SEM. *p < 0.05; **p < 0.01; ***p < 0.001; ****p < 0.0001 versus vehicle-treated gorup. #p < 0.05; ## p < 0.01; ### p < 0.001; #### p < 0.0001 versus DOPAL-treated group. $p < 0.05; $$ p < 0.01; $$$ p < 0.001; $$$$ p < 0.0001 versus αSynO-treated group
Fig. 7
Fig. 7
Navarixin protects against DOPAL and aSynO-induced PD-like behavioral deficits in mice. a: Schematics of the experimental design. Mice underwent baseline motor tests seven days prior to surgery. On day 0, mice received intracerebroventricular injections of either vehicle (saline) or 3 µg Navarixin, followed by intrastriatal injections of vehicle (Veh/Veh and Nava/Veh), 1 µg DOPAL (Veh/DOPAL and Nava/DOPAL), or 2 µg αSynO (Veh/αSynO and Nava/αSynO) after 30 min. Subsequently, mice underwent two sets of motor and non-motor behavioral tests at 5–7 and 28–30 days post-injection (dpi), followed by brain collection for histological analysis of the Caudate-Putamen nucleus (Cpu). b-e: Quantification of motor test performance at 28-30dpi. Latency time to fall in the rotarod test (b) and wire hanging test (WHT) (c). Latency time to turn to vertical position (d) and to descend to the lower compartment in the pole test (e). f-i: Open field test (OFT) assessment of mice general motility at 29dpi. Representative diagrams indicating mouse trajectory on the field (f) and quantification of the distance traveled per minute (g) or throughout the entire test duration (h). j-l: Quantification of mice anxiety-like behavior on the elevated plus maze (EPM) at 28dpi. Heatmap of mice permanence on the maze (j) and quantification of the number of entries in open arms (l). m: Quantification of the time spent in each compartment during the olfactory discrimination test (ODT) at 30dpi, distinguishing between familiar (F) and non-familiar (NF) odors. Statistical comparison with Veh/Veh group in motor and non-motor test: One-Way ANOVA test with Tukey’s multiple comparisons test (n = 12 mice/group from 4 independent experiments). ns: not-significant. *p < 0.05; **p < 0.01; ***p < 0.001; ****p < 0.0001. Statistical comparison with baseline values from same group of mice in motor tests: Friedman`s paired test with multiple comparisons. #p < 0.05; ## p < 0.01; ### p < 0.001; #### p < 0.0001. For ODT statistical analysis: Two-way ANOVA with Dunnett`s multiple comparison test against the reference value of 50% staying on each compartment. All data are presented as mean ± SEM

References

    1. Ben-Shlomo Y, Darweesh S, Llibre-Guerra J, Marras C, Luciano MS, Tanner C. The epidemiology of Parkinson’s disease. Lancet. 2024;403:283–92. - PMC - PubMed
    1. de Rijk MC, Launer LJ, Berger K, Breteler MM, Dartigues JF, Baldereschi M, et al. Prevalence of Parkinson’s disease in Europe: a collaborative study of population-based cohorts. Neurologic diseases in the Elderly Research Group. Neurology. 2000;54:S21–3. - PubMed
    1. Przedborski S. The two-century journey of Parkinson disease research. Nat Rev Neurosci. 2017;2017 18:4. - PubMed
    1. Palma J-A, Kaufmann H. Orthostatic Hypotension in Parkinson Disease. Clin Geriatr Med. 2020;36:53–67. - PMC - PubMed
    1. Aarsland D, Marsh L, Schrag A. Neuropsychiatric symptoms in Parkinson’s disease. Mov Disord. 2009;24:2175–86. - PMC - PubMed

MeSH terms