. 2025 Feb 2;16(1):1275.
doi: 10.1038/s41467-025-56543-0.

Deep learning to decode sites of RNA translation in normal and cancerous tissues

Affiliations

Deep learning to decode sites of RNA translation in normal and cancerous tissues

Jim Clauwaert et al. Nat Commun. .

Abstract

The biological process of RNA translation is fundamental to cellular life and has wide-ranging implications for human disease. Accurate delineation of RNA translation variation represents a significant challenge due to the complexity of the process and technical limitations. Here, we introduce RiboTIE, a transformer model-based approach designed to enhance the analysis of ribosome profiling data. Unlike existing methods, RiboTIE leverages raw ribosome profiling counts directly to robustly detect translated open reading frames (ORFs) with high precision and sensitivity, evaluated on a diverse set of datasets. We demonstrate that RiboTIE successfully recapitulates known findings and provides novel insights into the regulation of RNA translation in both normal brain and medulloblastoma cancer samples. Our results suggest that RiboTIE is a versatile tool that can significantly improve the accuracy and depth of Ribo-Seq data analysis, thereby advancing our understanding of protein synthesis and its implications in disease.


Conflict of interest statement

Competing interests: G.M. is an employee of OHMX Bio. Z.M. and R.G. are employees of Novo Nordisk Ltd. J.R.P. reports receiving honoraria from Novartis Biosciences. J.R.P. is a paid consultant for ProFound Therapeutics. A.I.N. receives royalties from the University of Michigan for the sale of MSFragger and IonQuant software licenses to commercial entities. The remaining authors declare no competing interests.

Figures

Fig. 1
Fig. 1. RiboTIE combines flexibility and performance for the detection of RNA translation in Ribo-Seq data.
a Schematic outlining RiboTIE’s function for the analysis of translated products (CDS coding sequence, uORF upstream open reading frame). (left) RiboTIE has been tested on Ribo-Seq from various cell types and translation inhibitors, where (middle) transformer models processing read counts aligned to transcripts are capable of leveraging information from both data with low and high in-frame read occupancy. (right) RiboTIE can be applied for a variety of studies, including start site analysis, detection of ncORFs, and expression profiling. b Benchmarking analyses featuring eight datasets. RiboTIE is compared with six other tools for translated ORF delineation from ribosome profiling. Precision recall (PR) or Receiver Operator Characteristic (ROC) Area Under the Curve (AUC) scores are compared on ORF libraries that are generated by and unique to each tool. Data in box plots show the median (line), 25th to 75th percentiles (box), and 1.5 times interquartile range (whiskers). c A stacked barplot that reflects the number of called annotated CDSs (left, all; right, <300 nt) for each ORF caller tool for six replicate samples of pancreatic progenitor cells, the fraction of CDSs that are found in a certain number of replicates is represented as well. d The total number of non-canonical ORFs (ncORFs) and each type of ncORFs called by each tool combining all predictions on the six replicate samples of pancreatic progenitor cells. The inner fractions represent ncORFs present in >4 datasets.
Fig. 2
Fig. 2. Application of RiboTIE to human normal tissues and brain cancer for improved analysis of RNA translation.
a Box plot showing the in-frame read occupancy (reads mapped to reading-frame by 5’-end vs. total reads within CDSs) for all data applied in this study (See Supplementary Dataset 1; MBL medulloblastoma). b Bar plot displaying the combined number of unique calls for annotated coding sequences (CDSs) and non-canonical ORFs (ncORFs) on 73 adult/fetal brain samples as reported by the original paper (RibORF) and RiboTIE. c A pie chart on the start codon distribution of all called ncORFs for the 73 adult/fetal brain samples. d Scatter plot displaying the Pearson r statistic and fitted linear regression function between the Area Under the Precision Recall curve (PR AUC) of RiboTIE on adult/fetal brain samples (n = 73) and mapped reads on the transcriptome and e in-frame read occupancy. f Number of CDSs called by RiboTIE outlined by both a scatter plot and box plot for medulloblastoma cell lines (n = 15) treated with Dimethylsulfoxide (DMSO) control or homoharringtonine (HHT). Identical cell lines are linked. g Scatter and fitted linear regression plot on 39 DMSO (blue) and 17 HHT (orange) medulloblastoma samples shows the improved performance of RiboTIE on HHT-treated cells. P-value by ANCOVA analysis between DMSO and HHT, with mapped reads as covariate. h Volcano plot showing differential expression of called ncORFs of low MYC (n = 8) as compared to high MYC (n = 15) expressing medulloblastoma cell lines. Threshold lines denote padj<0.05 (y-axis) and Fold Change>2 (x-axis). Blue dots accompanied by listed gene names are ncORFs confirmed by TIS Transformer. Differential expression analysis was performed with a two-sided Wald test. P values were adjusted for multiple comparisons using the Benjamini-Hochberg method. i Histogram showing ρ correlations of a two-sided Spearman test existent between ncORFs and their matching CDSs for both low MYC (blue) and high MYC (red) cell lines. Threshold lines denote p=0.05. j Scatter plots of two-sided Spearman rank correlations between the ncORF or downstream CDS and all other CDSs on the genome for both low and high MYC expression (DEPDC5/ACAT1). All error bands given denote a 95% confidence interval. All box plots show the median (line), 25th–75th percentiles (box), and data within 1.5 times interquartile range (whiskers).
Fig. 3
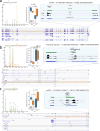
Fig. 3. Example ncORFs called by RiboTIE for which MS evidence is found.
Mass spectrometry is performed on 6 medulloblastoma cell lines (n = 3 MYC-high and n = 3 MYC-low) in technical triplicate, for 18 total data points (Supplementary Dataset 6). a an intORF in the SCRIB gene in shown. b an N-terminal extension of the RBMS1 gene is shown. c an uoORF in the ZNF717 gene is shown. For the three called ORF examples, each image shows (left) the mass spectrometry spectrum, (middle) the protein abundance values of the coding sequence (CDS) and non-canonical open reading frame (ncORF; e.g., intORF internal ORF, uoORF upstream overlapping ORF) for MYC-high and MYC-low cell lines, and (right; bottom), and the location of the peptide and the called ncORF in relation to the canonical coding sequence. P values are calculated by a two-sided Mann Whitney U test comparing the averaged values of MYC-high (n = 3) vs MYC-low (n = 3) cell lines. All box plots show the median (line), 25th–75th percentiles (box), and data within 1.5 times interquartile range (whiskers).

Update of

References

    1. Brito Querido J., Díaz-López I. & Ramakrishnan V. The molecular basis of translation initiation and its regulation in eukaryotes. Nat. Rev. Mol. Cell Biol. 1–19. 10.1038/s41580-023-00624-9 (2023). - PubMed
    1. Kang, J. et al. Ribosomal proteins and human diseases: molecular mechanisms and targeted therapy. Signal Transduct. Target. Ther.6, 323 (2021). - PMC - PubMed
    1. Mudge, J. M. et al. Standardized annotation of translated open reading frames. Nat. Biotechnol.40, 994–999 (2022). - PMC - PubMed
    1. Fedorova, A. D., Kiniry, S. J., Andreev, D. E., Mudge, J. M. & Baranov, P. V. Addendum: thousands of human non-AUG extended proteoforms lack evidence of evolutionary selection among mammals. Nat. Commun.15, 228 (2024). - PMC - PubMed
    1. Calviello, L., Hirsekorn, A. & Ohler, U. Quantification of translation uncovers the functions of the alternative transcriptome. Nat. Struct. Mol. Biol.27, 717–725 (2020). - PubMed

LinkOut - more resources