. 2025 Feb 3;135(3):e168730.
doi: 10.1172/JCI168730.

Translational regulation of SND1 governs endothelial homeostasis during stress

Affiliations

Translational regulation of SND1 governs endothelial homeostasis during stress

Zhenbo Han et al. J Clin Invest. .

Abstract

Translational control shapes the proteome and is particularly important in regulating gene expression under stress. A key source of endothelial stress is treatment with tyrosine kinase inhibitors (TKIs), which lowers cancer mortality but increases cardiovascular mortality. Using a human induced pluripotent stem cell-derived endothelial cell (hiPSC-EC) model of sunitinib-induced vascular dysfunction combined with ribosome profiling, we assessed the role of translational control in hiPSC-ECs in response to stress. We identified staphylococcal nuclease and tudor domain-containing protein 1 (SND1) as a sunitinib-dependent translationally repressed gene. SND1 translational repression was mediated by the mTORC1/4E-BP1 pathway. SND1 inhibition led to endothelial dysfunction, whereas SND1 OE protected against sunitinib-induced endothelial dysfunction. Mechanistically, SND1 transcriptionally regulated UBE2N, an E2-conjugating enzyme that mediates K63-linked ubiquitination. UBE2N along with the E3 ligases RNF8 and RNF168 regulated the DNA damage repair response pathway to mitigate the deleterious effects of sunitinib. In silico analysis of FDA-approved drugs led to the identification of an ACE inhibitor, ramipril, that protected against sunitinib-induced vascular dysfunction in vitro and in vivo, all while preserving the efficacy of cancer therapy. Our study established a central role for translational control of SND1 in sunitinib-induced endothelial dysfunction that could potentially be therapeutically targeted to reduce sunitinib-induced vascular toxicity.

Keywords: Cancer; Cardiovascular disease; Endothelial cells; Vascular biology.


Figures

Figure 1
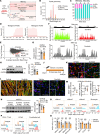
Figure 1. Generation of sunitinib-induced endothelial dysfunction model using hiPSCs.
(A) Schematic representation of the hiPSC-to-EC (iPSC-EC) differentiation workflow. (B) hiPSC-ECs were treated with various concentrations of sunitinib for 48 hours. Cell viability was determined using the PrestoBlue cell viability reagent. One-way ANOVA. Data are presented as mean ± SD. ***P < 0.001; ns, not significant. n = 12 replicates from the differentiation of 3 individual hiPSC lines. (C and D) hiPSC-ECs were treated with 2 μM sunitinib for 48 hours. EC function was determined by tube-formation assay. n = 9 replicates from the differentiation of 3 individual hiPSC lines. Scale bar: 220 μm. Two-tailed Student’s t test. Data are presented as mean ± SD. *P < 0.05, **P < 0.01. (E and F) Representative images and quantification of wound-healing ability of hiPSC-ECs in response to treatment with DMSO or sunitinib (2 μM) for 16 hours. The yellow lines indicate the edges of the scratch wound. The scratched areas were quantified as a percentage relative to the initial area at 0 hours. n = 9 replicates from the differentiation of 3 individual hiPSC lines. Scale bars: 220 μm. Two-tailed Student’s t test. Data are presented as mean ± SD. ***P < 0.001. (G and H) Representative images of immunostaining of the DNA damage marker γ-H2AX (red) in hiPSC-ECs after sunitinib treatment (2 μM) for 48 hours. Cells were counterstained with CD31 (green), an EC marker. n = 9 replicates from the differentiation of 3 individual hiPSC lines. Scale bars: 20 and 10 μm. Two-tailed Student’s t test. Data are presented as mean ± SD. ***P < 0.001.
Figure 2
Figure 2. Ribo-Seq of hiPSC-ECs identified that sunitinib inhibits SND1 translation.
(A) Schematic of RNA-Seq and Ribo-Seq of hiPSC-ECs to identify translationally regulated mRNAs in response to sunitinib treatment. Two independent hiPSC-EC lines were used for these analyses. (B) Read-length distribution and triplet periodicity for the Ribo-Seq dataset generated by RNase I. The reads are from a single principal transcript isoform from each gene. CDS, coding sequence. (C) Percentage of raw RNA-Seq and Ribo-Seq read counts over mRNA functional regions. C, control; S, sunitinib. (D) Metagene profile of normalized Ribo-Seq read density at the corresponding base positions relative to the start and stop codons. (E) Calculated translational efficiency (TE) of genes in sunitinib-treated (2 μM) versus DMSO-treated cells. Genes that did not change significantly are colored gray; upregulated genes are in blue; and downregulated genes are in red. (F) Normalized ribosome footprint (Ribo-Seq) reads and RNA-Seq reads of SND1 in response to DMSO or sunitinib treatment were analyzed by DESeq2. (G) RT-qPCR analysis of SND1 expression in hiPSC-ECs following sunitinib treatment revealed that the mRNA level of SND1 was unaltered. Two-tailed Student’s t test. Data are presented as mean ± SD. n = 9 replicates from the differentiation of 3 individual hiPSC lines. (H and I) Immunoblot analysis and quantification of SND1 expression in hiPSC-ECs in response to DMSO or sunitinib treatment. Two-tailed Student’s t test. Data are presented as mean ± SD. ***P < 0.001. n = 9 replicates from the differentiation of 3 individual hiPSC lines. (J) Schematic summarizing the strategy for induction of sunitinib-induced vascular dysfunction in mice. (K) Representative images of SND1 and CD31 coimmunostaining of heart sections from the mice described in J. Scale bars: 10 μm and 2 μm. (L) Representative images of SND1 and α-actinin or vimentin coimmunostaining of heart sections from mice described in J. Scale bars: 10 μm and 2 μm. (M) Quantification of the SND1+CD31+ (n = 6), SND1+ α-actinin+ (vehicle, n = 5; sunitinib, n = 6), and SND1+vimentin+ (vehicle, n = 5; sunitinib, n = 6) areas. Two-tailed Student’s t test. Data are presented as mean ± SD. ***P < 0.001. (N) Immunoblot analysis of isolated MCECs from the mice after sunitinib (Sun) (10 and 21 days) or vehicle (21 days) treatment. One-way ANOVA. Data are presented as mean ± SD. ***P < 0.001. n = 7. (OQ) Flow cytometry analysis of SND1 expression in different cardiac macrophage subsets and cardiac monocytes, T cells, B cells, and ECs in hearts from sunitinib-treated (21 days) or vehicle-treated (21 days) mice. Two-tailed Student’s t test. Data are presented as mean ± SD. *P < 0.05. n = 3.
Figure 3
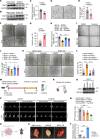
Figure 3. Inhibition of mTOR by sunitinib represses SND1 translation via 4E-BP1.
(A and B) Immunoblot analysis of SND1, mTOR, and its downstream target, 4E-BP1, in hiPSC-ECs treated with DMSO or sunitinib (2 μM) for 48 hours revealed a reduction in p-mTOR and p–4E-BP1 in response to sunitinib treatment. Two-tailed Student’s t test. Data are presented as mean ± SD. ***P < 0.001. n = 6 replicates from the differentiation of 2 individual hiPSC lines. (C and D) hiPSC-ECs were treated with rapamycin (100 nM) or sunitinib or pretreated with MHY-1485 (10 μM) for 12 hours before being treated with sunitinib (2 μM) or DMSO. Rapamycin treatment inhibited the SND1 level, and repression of SND1 by sunitinib was rescued by MHY-1485. One-way ANOVA. Data are presented as mean ± SD. *P < 0.05, ***P < 0.001. n = 6 replicates from the differentiation of 3 individual hiPSC lines. (E) hiPSC-ECs were transduced with lentivirus carrying a doxycycline-inducible (DOX-inducible) 4E-BP1-4Ala mutant gene. Following exposure (exp.) to DOX (1 μg/mL) for 48 hours, protein expression of SND1 and 4E-BP1 was detected by immunoblotting. (F and G) hiPSC-ECs were transduced with shScramble (shScr) or shRNAs against 4E-BP1 and 4E-BP2 (sh4E-BP1/2), before being treated with sunitinib (2 μM) or DMSO. Repression of SND1 by sunitinib was rescued when both 4E-BPs were genetically suppressed. One-way ANOVA. Data are presented as mean ± SD. **P < 0.01, ***P < 0.001. n = 9 replicates from the differentiation of 3 individual hiPSC lines. (H) hiPSC-ECs were treated with ZM 323881 (VEGFR2 inhibitor) at different concentrations for 24 hours. Immunoblot analysis indicated that ZM 323881 did not affect SND1 in ECs. (I) hiPSC-ECs were treated with CP-673451 (PDGFR inhibitor) at different concentrations for 24 hours. Immunoblot analysis indicated that CP-673451 did not affect SND1 in ECs. (J) hiPSC-ECs were treated with imatinib (c-Kit and PDGFR inhibitor) at different concentrations for 24 hours. Numerical values below the blots indicate quantification of SND1 bands relative to GAPDH. Immunoblot analysis indicated that imatinib did not affect SND1 in ECs.
Figure 4
Figure 4. SND1 is a critical regulator of endothelial health.
(A and B) The efficacy of SND1 KD and SND1 OE in hiPSC-ECs was validated by immunoblotting. (C) The effects of SND1 KD on EC function were determined by PrestoBlue viability assay. Two-tailed Student’s t test. Data are presented as mean ± SD. ***P < 0.001. n = 9 replicates from the differentiation of 3 individual hiPSC lines. (D and E) Representative images and quantification of the tube-formation efficiency of hiPSC-ECs following KD of SND1. Scale bar: 340 μm. Two-tailed Student’s t test. Data are presented as mean ± SD. ***P < 0.001. n = 9 replicates from the differentiation of 3 individual hiPSC lines. (F and G) Representative images and quantification of the wound-healing ability of hiPSC-ECs following KD of SND1. Two-tailed Student’s t test. Data are presented as mean ± SD. ***P < 0.001. n = 9 replicates from the differentiation of 3 individual hiPSC lines. Scale bar: 220 μm. (H) PrestoBlue viability assay in sunitinib-treated SND1 OE hiPSC-ECs. One-way ANOVA. Data are presented as mean ± SD. ***P < 0.001. n = 9 replicates from the differentiation of 3 individual hiPSC lines.(I and J) Effects of SND1 OE on hiPSC-ECs treated with DMSO or sunitinib (2 μM) were determined by tube-formation assay. One-way ANOVA. Data are presented as mean ± SD. *P < 0.05. n = 6 replicates from the differentiation of 2 individual hiPSC lines. Scale bar: 220 μm. (K and L) Wound-healing assay on sunitinib-treated SND1 OE hiPSC-ECs. One-way ANOVA. Data are presented as mean ± SD. ***P < 0.001. n = 9 replicates from the differentiation of 3 individual hiPSC lines. Scale bar: 220 μm (M) Schematic of experimental design to assess the physiological significance of SND1 in vivo. (N and O) Immunoblot analysis revealed that AAV9-shSND1 treatment inhibited SND1 protein levels in MCECs. (P) Representative ultrasound tracings of dilated (induced with 2.5% isoflurane) and basal (with 1% isoflurane) coronary flow. (Q) Quantification of CFR (dilated/basal flow) in mice. One-way ANOVA. Data are presented as mean ± SD. *P < 0.05, **P < 0.01, ***P < 0.001. AAV9-shSND1 + Sunitinib: n = 7. Other groups: n = 8 each. (R) Schematic of the Matrigel plug assay. mECs, mouse ECs labeled with CM-Dil dye. (S and T)) Representative gross images and hemoglobin content of explanted Matrigel plugs. One-way ANOVA. Data are presented as mean ± SD. ***P < 0.001. n = 4.
Figure 5
Figure 5. SND1 regulates endothelial homeostasis via UBE2N.
(A) Gene ontology (GO) analysis of DEGs in RNA-Seq data obtained from hiPSC-ECs transduced with scramble shRNA or shSND1. Multiple ubiquitination-related processes were enriched among downregulated genes in SND1-KD hiPSC-ECs. (B) Immunoblot analysis confirmed that suppression of SND1 in hiPSC-ECs was associated with overall reduced levels of total ubiquitinated proteins. (C) RT-qPCR was performed on selected targets from RNA-Seq analysis to identify genes that were oppositely expressed in hiPSC-ECs after SND1 OE versus KD. n = 3 technical replicates. One-way ANOVA. Data are presented as mean ± SD. *P < 0.05, **P < 0.01, ***P < 0.001. (D) Immunoblotting demonstrating that UBE2N was reduced in shSND1 hiPSC-ECs and increased in SND1-OE hiPSC-ECs. (E) Co-IP analysis of the association between SND1 and UBE2N. (F) Effects of shUBE2N or UBE2N-OE on sunitinib-induced endothelial injury were determined by viability assay. One-way ANOVA. Data are presented as mean ± SD. ***P < 0.001. n = 9 replicates from the differentiation of 3 individual hiPSC lines. (G) Effects of shUBE2N or UBE2N OE on sunitinib-induced endothelial injury were determined by tube-formation assay. Scale bars: 220 μm. (H) Representative immunoblotting demonstrating that suppression of either SND1 or UBE2N led to downregulation of K63-linked polyubiquitination, while the overexpression of either SND1 or UBE2N led to upregulation of K63 in hiPSC-ECs. (I)Immunostaining of 53BP1 and γ-H2AX in hiPSC-ECs. DAPI was used for nuclear staining. Scale bars: 10 μm. One-way ANOVA. Data are presented as mean ± SD. *P < 0.05, **P < 0.01, ***P < 0.001. Blank+DMSO: 123 cells were quantified, n = 17 replicates. shUBE2N+DMSO: 151 cells were quantified, n = 26 replicates. UBE2N OE+DMSO: 143 cells were quantified, n = 19 replicates. Blank+sunitinib: 139 cells were quantified, n = 22 replicates. shUBE2N+sunitinib: 100 cells were quantified, n = 26 replicates. UBE2N OE+sunitinib: 131 cells were quantified, n = 23 replicates. (J) Cell viability assays showed that the protection conferred by UBE2N OE against sunitinib (SUN) was abrogated upon KD of RNF168 but not RNF8, HLTF, or SHPRH. One-way ANOVA. Data are presented as mean ± SD. ***P < 0.001. n = 9 replicates from the differentiation of 3 individual hiPSC lines. (K) Co-IP analysis of the association between UBE2N and RNF8 or RNF168. (L) hiPSC-ECs were transduced with blank vector, UBE2N OE, shScramble (CTL), shRNF8, shRNF168, shHLTF, or shSHPRH and then treated with DMSO or sunitinib, followed by immunostaining against 53BP1 and γ-H2AX. DAPI was used for nuclear staining. Scale bars: 5 μm.
Figure 6
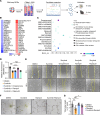
Figure 6. Identification of ramipril as a candidate compound that protects against sunitinib-induced vascular dysfunction.
(A) Schematic of in silico drug screening using a Connectivity Map (CMap) approach. (B) Heatmap representing the shSND1-regulated genes (red: 20 most upregulated; blue: 20 most downregulated) obtained from RNA-Seq data. (C) Chemical compound ranking chart based on connectivity score (Norm_cs) and transcriptional activity score (tas). moa, mechanism of action. (D) hiPSC-ECs were treated with drospirenone (250 nM), ramipril (3 μM), or ripasudil (1 μM) along with sunitinib (2 μM) or DMSO for 48 hours. Cell viability was determined using the PrestoBlue cell viability reagent. One-way ANOVA. Data are presented as mean ± SD. ***P < 0.001. n = 9 replicates from the differentiation of 3 individual hiPSC lines. (E) Representative images of wound-healing ability of hiPSC-ECs treated with sunitinib (2 μM) for 48 hours in the presence and absence of drospirenone (250 nM), ramipril (3 μM), or ripasudil (1 μM). Treatment with DMSO was used as control. The yellow lines indicate the edges of the scratch wound. Scale bars: 220 μm. (F and G) hiPSC-ECs were treated with sunitinib (0.25 μM) for 48 hours in the presence and absence of ramipril (3 μM). Endothelial cell function was determined by tube-formation assay. Scale bar: 100 μm. One-way ANOVA. Data are presented as mean ± SD. *P < 0.05, **P < 0.01. n = 6 replicates from the differentiation of 3 individual hiPSC lines.
Figure 7
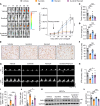
Figure 7. Ramipril alleviates sunitinib-induced vascular dysfunction without compromising its antitumor efficacy in vivo.
Orthotopic tumors were induced via injection of 786-O-Fluc cells into right kidney (day 0). The indicated drugs or vehicle were administered via oral gavage once daily from day 16 to day 37. n = 6 mice per group. (A) Representative BLIs of nude mice. (B) Tumor growth was monitored weekly by BLI and measured as photons/s. Two-way ANOVA. Data are presented as mean ± SD. ***P < 0.001. n = 6 per group. Calculated tumor volume (C) and tumor weight (D) in each group on day 45 after tumor xenograft. n = 6 per group. One-way ANOVA. Data are presented as mean ± SD. **P < 0.01 ***P < 0.001. (E and F) Immunohistochemical staining of Ki-67 in tumors. Scale bar: 50 μm. One-way ANOVA. Data are presented as mean ± SD. ***P < 0.001. n = 6 in each group. (G) Representative ultrasound tracings of dilated (induced with 2.5% isoflurane) and basal (with 1% isoflurane) coronary flow after 21 days of treatment with sunitinib (40 mg/kg/d) in the presence and absence of ramipril (10 mg/kg/d). (H) Quantification of coronary flow reserve (CFR) (dilated/basal flow) in sunitinib-treated mice in the presence and absence of ramipril and corresponding vehicle-treated mice. One-way ANOVA. Data are presented as mean ± SD. *P < 0.05, **P < 0.01. Ramipril group: n = 4. Other groups: n = 5 each. (I) Quantification of CD31/53BP1 staining in heart sections of xenografted nude mice (day 45 after tumor xenograft). One-way ANOVA. Data are presented as mean ± SD. ***P < 0.001. Vehicle: n = 5. Sunitinib: n = 4. Ramipril: n = 5. Sunitinib+ramipril: n = 4. (J) Quantification of CD31/γ-H2AX staining in heart sections of xenografted nude mice (day 45 after tumor xenograft). One-way ANOVA. Data are presented as mean ± SD. *P < 0.05, ***P < 0.001. Sunitinib+ramipril group: n = 5. Other groups: n = 6 each. (K and L) Immunoblot analysis revealed that ramipril was unable to reverse sunitinib’s inhibition of SND1 in isolated MCECs (21 days after drug treatment). One-way ANOVA. Data are presented as mean ± SD. ***P < 0.001. n = 6.

References

    1. Tahmasebi S, et al. Translation deregulation in human disease. Nat Rev Mol Cell Biol. 2018;19(12):791–807. doi: 10.1038/s41580-018-0034-x. - DOI - PubMed
    1. Bhat M, et al. Targeting the translation machinery in cancer. Nat Rev Drug Discov. 2015;14(4):261–278. doi: 10.1038/nrd4505. - DOI - PubMed
    1. Lee TI, Young RA. Transcriptional regulation and its misregulation in disease. Cell. 2013;152(6):1237–1251. doi: 10.1016/j.cell.2013.02.014. - DOI - PMC - PubMed
    1. Doroudgar S, et al. Monitoring cell-type-specific gene expression using ribosome profiling in vivo during cardiac hemodynamic stress. Circ Res. 2019;125(4):431–448. doi: 10.1161/CIRCRESAHA.119.314817. - DOI - PMC - PubMed
    1. Ingolia NT. Ribosome profiling: new views of translation, from single codons to genome scale. Nat Rev Genet. 2014;15(3):205–213. doi: 10.1038/nrg3645. - DOI - PubMed

MeSH terms