. 2025 Jan 10:11:100283.
doi: 10.1016/j.jmccpl.2025.100283. eCollection 2025 Mar.

Deep plasma and tissue proteome profiling of knockout mice reveals pathways associated with Svep1 deficiency

Affiliations

Deep plasma and tissue proteome profiling of knockout mice reveals pathways associated with Svep1 deficiency

Colleen B Maxwell et al. J Mol Cell Cardiol Plus. .

Abstract

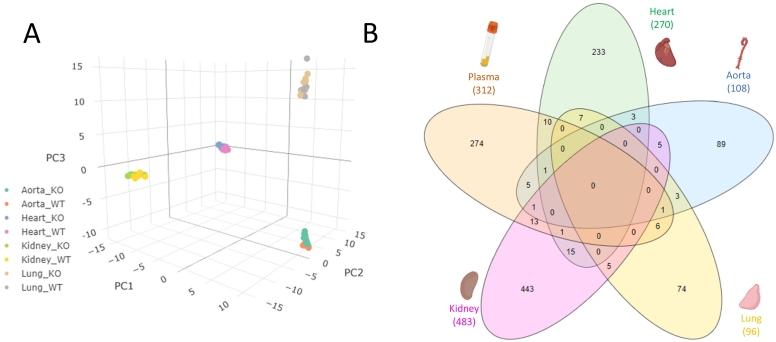
Despite strong causal associations with cardiovascular and metabolic disorders including coronary artery disease, hypertension, and type 2 diabetes, as well as a range of other diseases, the exact function of the protein SVEP1 remains largely unknown. Animal models have been employed to investigate how SVEP1 contributes to disease, with a focus on murine models exploring its role in development, cardiometabolic disease and platelet biology. In this study, we aimed to comprehensively phenotype the proteome of Svep1 +/- mice compared to wild-type (WT) littermates using liquid chromatography-tandem mass spectrometry (LC-MS/MS) bottom-up proteomics in plasma, heart, aorta, lung, and kidney to identify dysregulated pathways and biological functions associated with Svep1 deficiency. Our findings reveal that Svep1 deficiency leads to significant proteomic alterations across the mouse, with the highest number of dysregulated proteins observed in plasma and kidney. Key dysregulated proteins in plasma include upregulation of ADGRV1, CDH1, and MYH6, and downregulation of MTIF2 and AKAP13 which, alongside other proteins dysregulated across tissues, indicate disruption in cell adhesion, extracellular matrix organisation, platelet degranulation, and Rho GTPase pathways. Novel findings include significant enrichment of complement cascades in plasma, suggesting dysregulation of innate immune responses and hemostasis due to Svep1 deficiency. Pathways related to chylomicron assembly and lipid metabolism were also enriched. Additionally, we developed a high-throughput quantitative targeted LC-MS/MS assay to measure endogenous levels of murine SVEP1. SVEP1 was detectable in lung homogenate and showed a significant reduction in SVEP1 levels in Svep1 +/- vs. WT, but was not identified in plasma, heart, aorta, or kidney, likely due to expression levels below the assay's detection limit. Overall, this deep phenotyping study provides insight into the systemic impact of Svep1 deficiency.

Keywords: Cardiovascular disease; Deep phenotyping; Extracellular matrix; Knockout mouse; Liquid chromatography-mass spectrometry; Proteomics; SVEP1.


Conflict of interest statement

The authors declare they have no competing interests.

Figures

Unlabelled Image
Graphical abstract
Fig. 1
Fig. 1
Flow diagram showing the workflow followed in this work. Plasma, heart, aorta, lung and kidney was harvested from Svep1+/− and WT littermates. Samples were prepared using automated bottom-up proteomics protocols with the Bravo AssayMAP, with plasma subjected to fractionation to provide deeper proteome coverage. Samples were analysed by shotgun mass spectrometry to provide phenotyping of the downstream pathways affected by Svep1 deficiency, and by targeted mass spectrometry assay for unique SVEP1 peptides.
Fig. 2
Fig. 2
Distinct differences in the plasma proteomes of Svep1+/− mice (n = 8) and WT littermates (n = 10). (A) 3D PCA plot demonstrating clear differences in the protein profiles of Svep1+/− mice (KO, green) compared to wildtype (WT, blue) littermates. Each point represents a single technical (MS) replicate of n = 18 KO and WT plasma samples. (B) Volcano plot following differential expression analysis (moderated t-test) of Svep1+/− mice vs. WT littermates with vertical cut-offs at FC -1.5 and + 1.5 and horizontal cut-off at BH adj. p-value of 0.05. The red features annotated with their accession numbers meet the thresholds: 176 proteins upregulated in Svep1 deficiency and 136 downregulated. (C) Dot plot showing the enriched biological process pathways for the proteins which are significantly dysregulated in the plasma of Svep1 deficient mice. For each pathways the adjusted p-values (FDR) are shown on the x-axis and colour scale, with the size of the dots representing % Members: the percentage of dysregulated genes in this study that are found in the given ontology term of the pathway. (For interpretation of the references to colour in this figure legend, the reader is referred to the web version of this article.)
Fig. 3
Fig. 3
Chord diagram showing the core proteins of 12 significant pathways in the plasma of Svep1+/− mice (n = 8) vs. WT littermates (n = 10). Significant pathways are shown on the right, connected to their member core proteins on the left with the coloured ribbons. The colour key for each pathways and logFC of the member proteins is shown on the bottom. Fold change of core proteins is shown on the left. On the right, STRING functional protein-protein interaction (PPI) network clusters for a selection of pathways are shown – complement and coagulation cascades (red), chylomicron assembly (green), insulin receptor activity (turquoise), and regulation of muscle development (pink). (For interpretation of the references to colour in this figure legend, the reader is referred to the web version of this article.)
Fig. 4
Fig. 4
Pathway diagram of complement and coagulation cascades including the Svep1 deficiency-induced differentially expressed proteins. Green boxes show the protein groups for which there are differentially changed components or proteins in this study in the pathway. Proteins in red font are upregulated (+) and in blue font (−) are downregulated. Adapted from KEGG Pathway Maps. (For interpretation of the references to colour in this figure legend, the reader is referred to the web version of this article.)
Fig. 5
Fig. 5
Proteome profiles in the tissue of Svep1+/− mice and WT littermates. Heart n = 15, 9 Svep1+/− and 6 WT; aorta n = 19, 9 Svep1+/− and 10 WT; lung n = 16, 8 Svep1+/− and 8 WT; kidney n = 16, 8 Svep1+/− and 8 WT. (A) 3D PCA plot demonstrating clear discrimination between each of the mouse tissues (aorta, heart, kidney and lung), and within each tissue different protein profiles between Svep1+/− mice (KO) compared to wildtype (WT) littermates for one technical (MS) replicate of each sample. (B) Venn diagram showing the overlap in dysregulated proteins between the four tissues and plasma. In total there are 1636 differentially expressed proteins in Svep1+/− mice compared to WT littermates. 191 of these proteins are differentially expressed in two or more tissues, 17 in three or more tissues, and 2 proteins in four tissues: Rho GTPase-activating protein 6 (ARHGAP6) and Fibrinogen gamma chain (FGG).
Fig. 6
Fig. 6
Dot plot showing the enriched biological process pathways for the proteins which are significantly dysregulated in the tissues of Svep1 deficient mice. For each pathways the adjusted p-values (FDR) are shown on the x-axis and colour scale, with the size of the dots representing % Members: the percentage of dysregulated genes in this study that are found in the given ontology term of the pathway. Enriched pathways are shown for the (A) Heart (green) (B) Aorta (blue) (C) Lung (yellow) and (D) Kidney (pink). (For interpretation of the references to colour in this figure legend, the reader is referred to the web version of this article.)
Fig. 7
Fig. 7
Biological processes which are significantly enriched across tissues and plasma. (A) Overlap in significantly enriched processes across matrices: white-filled space indicates the pathways was not significantly enriched in that particular tissue, and a colour-filled space represents significant enrichment (orange in plasma, green in heart, blue in aorta, yellow in lung, and pink in kidney). (B) Schematic illustrating the interconnected feedback loops between the cytoskeleton, actin machinery, and adhesions at the extracellular matrix. Forces generated by actin polymerisation impact mechanosensitive proteins across multiple functions, including actin-linking, receptor, and co-receptor modules, as well as associated actin-polymerising and signaling modules. This interaction forms a mechanoresponsive network, where the integrated response of the system to matrix interactions and mechanical forces determines the effect on the actin cytoskeleton. Stimulation of the signaling molecules leads to the activation of GTPase-activating proteins, ultimately influencing actin dynamics and the configuration of focal adhesion complexes. Example proteins involved in each process which are differentially expressed in the Svep1 deficient mice are highlighted. The direction of dysregulation (up/downregulated) for these proteins in each of the tissues can be found in the supporting information. Figure inspired by Geiger et al. [43] and Huber et al. [44]. (For interpretation of the references to colour in this figure legend, the reader is referred to the web version of this article.)
Fig. 8
Fig. 8
Measurement of SVEP1 using a LC-MS/MS MRM bottom-up proteomics assay. (A) Chromatograms for the unique SVEP1 mus musculus peptides LTCQGNAQWDGPEPR (measuring the y6, y4 and y4 fragments) and GAFQQAAQILR (measuring the y7, y6 and y4 fragments), with respective retention times (RT) of 1.6 and 1.2 mins annotated at the peak apex. (B) Ratio-to-heavy calibration curve for determination of the concentration (fmol/μL) of GAF[…]. (C) Chromatogram showing the measurement of endogenous GAF[…] (red, 14.6 fmol) using the ratio to SILS (blue, 50.0 fmol) coeluting at an RT of 1.6 mins (annotated at the peak apex) in a lung homogenate sample. (D) Boxplot showing the levels of SVEP1 GAF[…] measured in the murine lung homogenate (n = 16 biological replicates, 8 Svep1+/− mice vs. 8 WT littermates. 3 technical teplicates (MS) per sample). SVEP1 expression is significantly higher in the lungs of WT mice. (For interpretation of the references to colour in this figure legend, the reader is referred to the web version of this article.)

References

    1. Shur I., Socher R., Hameiri M., Fried A., Benayahu D. Molecular and cellular characterization of SEL-OB/SVEP1 in osteogenic cells in vivo and in vitro. J Cell Physiol. 2006;206(2):420–427. - PubMed
    1. Myocardial Infarction G., Investigators C.A.E.C., Stitziel N.O., Stirrups K.E., Masca N.G., Erdmann J., et al. Coding variation in ANGPTL4, LPL, and SVEP1 and the risk of coronary disease. N Engl J Med. 2016;374(12):1134–1144. - PMC - PubMed
    1. Sun B.B., Maranville J.C., Peters J.E., Stacey D., Staley J.R., Blackshaw J., et al. Genomic atlas of the human plasma proteome. Nature. 2018;558(7708):73–79. - PMC - PubMed
    1. Jung I.H., Elenbaas J.S., Alisio A., Santana K., Young E.P., Kang C.J., et al. SVEP1 is a human coronary artery disease locus that promotes atherosclerosis. Sci Transl Med. 2021;13(586) - PMC - PubMed
    1. Emilsson V., Gudmundsdottir V., Gudjonsson A., Jonmundsson T., Jonsson B.G., Karim M.A., et al. Coding and regulatory variants are associated with serum protein levels and disease. Nat Commun. 2022;13(1):481. - PMC - PubMed

LinkOut - more resources