. 2025 Jan 17:15:1508765.
doi: 10.3389/fmicb.2024.1508765. eCollection 2024.

VdPAT1 encoding a pantothenate transporter protein is required for fungal growth, mycelial penetration and pathogenicity of Verticillium dahliae

Affiliations

VdPAT1 encoding a pantothenate transporter protein is required for fungal growth, mycelial penetration and pathogenicity of Verticillium dahliae

Stephen Mwangi Kamau et al. Front Microbiol. .

Abstract

Introduction: The soil-borne vascular fungus Verticillium dahliae is a phytopathogenic fungus known to attack cotton crop causing Verticillium wilt. In previous study, we identified a pantothenate transporter gene (VdPAT1) in V. dahliae which can be induced by root exudates from a susceptible cotton variety.

Methods: In this study, we generated VdPAT1 deletion mutants and complementary strain via homologous recombination by a PEG-mediated transformation method and used for the gene functional characterization.

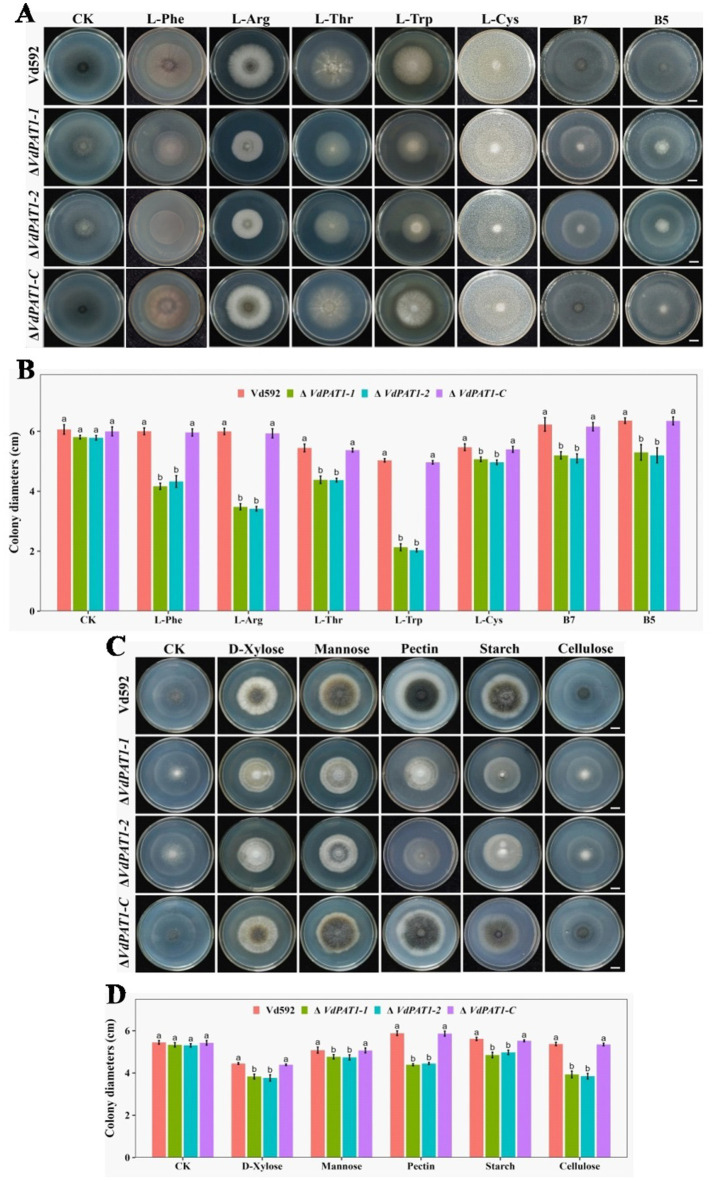
Results and discussion: The VdPAT1 deletion mutants displayed reduced colony growth, melanin production, spore yield and germination rate, showed abnormal mycelial branching and decreased ability of mycelial penetration and utilization of nutrients (carbon, amino acids and vitamin), leading to a lower pathogenicity. Comparative transcriptome analysis of wild-type and mutant strain cultivated on sterilized carboxymethyl cellophane membranes found that the amino sugar and nucleotide sugar metabolism pathway, which was related to chitin synthesis and degradation as well as UDP-glucose synthesis, was the most significantly down-regulated pathway in VdPAT1 deletion mutant. Chitin and β-1,3-glucan content determination found that the chitin content in VdPAT1 deletion mutants was significantly lower, while β-1,3-glucan content was higher than that of wild-type and complementary strains. The ratio change of chitin and β-1,3-glucan content in VdPAT1 deletion mutants might lead to abnormal branching of mycelium, resulting in the reduced penetration ability of V. dahliae. The decreased chitin content in VdPAT1 mutants impaired the fungal cell wall integrity, leading to their increased sensitivity to external stresses.

Conclusion: Together, the results demonstrated that VdPAT1 is required for growth, development, resistance to external stresses, mycelial penetration and pathogenicity of V. dahliae.

Keywords: RNA-Seq; Verticillium dahliae; cotton; mycelial penetration; pantothenate transporter.


Conflict of interest statement

The authors declare that the research was conducted in the absence of any commercial or financial relationships that could be construed as a potential conflict of interest. The author(s) declared that they were an editorial board member of Frontiers, at the time of submission. This had no impact on the peer review process and the final decision.

Figures

Figure 1
Figure 1
Bioinformatics analysis of pantothenate transporter genes. (A) The MFS conserved domain in VdPAT1 predicted by SMART tool. (B) The transmembrane domains (TMDs) in VdPAT1 predicted by Deep TMHMM software. (C) The phylogenetic tree for pantothenate transporter genes from V. dahliae, other fungi and bacteria. The tree was generated using MEGA 11.0 with the neighbor-joining method and 1,000 bootstraps replications. (D) Multiple sequence alignment showing the conserved residues in pantothenate transporters of ACS subfamily. “GEPWPER” are the reported conserved residues in ACS subfamily. The yellow colour illustrated the conserved residues of 5 members of ACS subfamily. The protein (XP_009656593.1) marked with a red circle is VdPAT1.
Figure 2
Figure 2
Colony morphology of different V. dahliae strains. (A) Colony morphology of different V. dahliae strains on PDA, Czapek and CM medium plates. Images were taken at 15 days post cultivation. (B) Colony diameters of different V. dahliae strains on PDA, Czapek and CM media plates. Scale bars represent 10 mm. Data were statistically analyzed on R environment (version 4.3.2). The ggplot2 package was employed to generate bar plots which represented mean ± standard deviation from three independent repeats. Significance differences between treatments were analyzed by one-way ANOVA using Duncan’s multiple range tests (DMRT) implemented on agricolae package. Different letters on error bars represent significance differences at p ≤ 0.05.
Figure 3
Figure 3
Conidial yield, conidial germination rate, and mycelial growth, morphology and penetration abilities of different V. dahliae strains. (A) Conidial yield of different V. dahliae strains after 7 days of culture at 25°C in liquid CM medium. (B) The conidial germination rate of different V. dahliae strains after 6 h of incubation at 25°C in liquid CM medium. (C) Mycelial growth of different V. dahliae strains after 5 days of culture on PDA medium plates. Scale bars represent 100 μm. (D) Mycelial morphology of different V. dahliae strains after 30 h of incubation at 25°C in liquid CM medium. Scale bars represent 100 μm. (E) Cellophane penetration assay of different V. dahliae strains. Different strains were grown on PDA medium plates covered with cellophane at 7 days post cultivation (Top). Different strains were gown on PDA medium after removing cellophane for another 7 days of cultivation (Bottom). Scale bars represent 1 cm. Data were statistically analyzed on R environment (version 4.3.2). The ggplot2 package was employed to generate bar plots which represented mean ± standard deviation from three independent repeats. Significance differences between treatments were analyzed by one-way ANOVA using Duncan’s multiple range tests (DMRT) implemented on agricolae package. Different letters on error bars represent significance differences at p ≤ 0.05.
Figure 4
Figure 4
Pathogenicity assay of different V. dahliae strains. (A) The disease phenotypes of cotton plants infected with different strains at 14 dpi (days post infection) and 28 dpi. Scale bars represent 10 cm. Stem longitudinal sections of infected cotton plants at 21 dpi. Scale bars represent 1 cm. (B) Disease index of cotton plants infected with different strains at 14 dpi and 28 dpi. (C) The relative fungal biomass in cotton plants infected with different strains at 21 dpi. Data were statistically analyzed on R environment (version 4.3.2). The ggplot2 package was employed to generate bar plots which represented mean ± standard deviation from three independent repeats. Significance differences between treatments were analyzed by one-way ANOVA using Duncan’s multiple range tests (DMRT) implemented on agricolae package. Asterisks (*) and (**) on error bars represent significance differences at p ≤ 0.05 and p ≤ 0.01, respectively.
Figure 5
Figure 5
Colony morphology of different V. dahliae strains cultivated on different nitrogen, vitamin and carbon resources. (A) The colony morphology of different V. dahliae strains on Czapek medium plates supplemented with different amino acids (L-Phe, L-Arg, L-Thr, L-Trp or L-Cys) and vitamins (B7 or B5). Images were taken at 15 days post cultivation. CK represents different strains on Czapek medium without amino acids and vitamins. Scale bars represent 1 cm. (B) The colony diameters of different V. dahliae strains on Czapek medium supplemented with different amino acids and vitamins. (C) The colony morphology of different V. dahliae strains on Czapek medium plates supplemented with different carbon resources (D-xylose, mannose, pectin, starch or cellulose). Images were taken at 15 days post cultivation. CK represents different strains on Czapek medium without carbon resources. Scale bars represent 1 cm. (D) The colony diameters of different V. dahliae strains on Czapek medium plates supplemented with different carbon resources. Data were statistically analyzed on R environment (version 4.3.2). The ggplot2 package was employed to generate bar plots which represented mean ± standard deviation from three independent repeats. Significance differences between treatments were analyzed by one-way ANOVA using Duncan’s multiple range tests (DMRT) implemented on agricolae package. Different letters on error bars represents significance differences at p ≤ 0.05.
Figure 6
Figure 6
GO and KEGG enrichment analyses of differentially expressed genes. (A) GO enrichment analysis of up-regulated DEGs in VdPAT1 deletion mutant. X-axis represents the −log10 (p value), and Y-axis represents the top 15 enriched GO terms. (B) KEGG pathways analysis of up-regulated DEGs in VdPAT1 deletion mutant. X-axis represents the enrichment factor, and the Y-axis lists the top 20 enriched pathways. (C) GO enrichment analysis of down-regulated DEGs in VdPAT1 deletion mutant. (D) KEGG pathways analysis of down-regulated DEGs in VdPAT1 deletion mutant.
Figure 7
Figure 7
Heatmaps of DEGs related to chitin synthesis and degradation and UDP glucose synthesis. (A) A simple diagram showing the relationship of DEGs and chitin formation and decomposition. (B) A heatmap showing the expression level of DEGs related to chitin formation and decomposition. (C) A simple diagram showing the relationship of DEGs and UDP-glucose synthesis. (D) A heatmap showing the expression level of DEGs related to UDP-glucose synthesis. The heatmap was generated based on the FPKM value of genes provided by RNA-seq data.
Figure 8
Figure 8
Chitin and β-1,3-glucan content of different V. dahliae strains. (A) Chitin content of different V. dahliae strains by using the same samples as RNA-seq. (B) Chitin content of different V. dahliae strains by using the samples cultured in liquid CM medium. (C) β-1,3-glucan content of different V. dahliae strains by using the same samples as RNA-seq. (D) β-1,3-glucan content of different V. dahliae strains by using the samples cultured in liquid CM medium. The abbreviations (ng/mL) on Y-axis means nanogram per milliliter of the sample. Data were statistically analyzed on R environment (version 4.3.2). The ggplot2 package was employed to generate bar plots which represented mean ± standard deviation from three independent repeats. Significance differences between treatments were analyzed by one-way ANOVA using Duncan’s multiple range tests (DMRT) implemented on agricolae package. Different letters on error bars represents significance differences at p ≤ 0.05.
Figure 9
Figure 9
Colony morphology of different V. dahliae strains cultivated on cell wall perturbing agents and other external stress agents. (A) The colony morphology of different V. dahliae strains on CM medium plates supplemented with cell wall perturbing agents (Congo red, CFW or SDS) and other external stresses agents (NaCl, H2O2 or mannitol). The CK represents different strains cultivated on CM medium without stress agents. Scale bars represent 1 cm. Images were taken at 15 days post cultivation. (B) The colony inhibition rates of different V. dahliae strains on CM medium plates supplemented with cell wall perturbing agents and other external stresses agents. Data were statistically analyzed on R environment (version 4.3.2). The ggplot2 package was employed to generate bar plots which represented mean ± standard deviation from three independent repeats. Significance differences between treatments were analyzed by one-way ANOVA using Duncan’s multiple range tests (DMRT) implemented on agricolae package. Different letters on error bars represents significance differences at p ≤ 0.05.
Figure 10
Figure 10
A working model for the role of VdPAT1 in the mycelial growth, stress resistance and pathogenicity of V. dahliae.

Similar articles

References

    1. Albuquerque C. C., Camara T. R., Mariano R. L. R., Willadino L., Marcelino J. C., Ulisses C. (2006). Antimicrobial action of the essential oil of Lippia gracilis schauer. Braz. Arch. Biol. Technol. 49, 527–535. doi: 10.1590/S1516-89132006000500001 - DOI
    1. Aron O., Wang M., Lin L., Batool W., Lin B., Shabbir A., et al. . (2021). MoGLN2 is important for vegetative growth, conidiogenesis, and maintenance of cell wall integrity and pathogenesis of Magnaporthe oryzae. J. Fungi. 7:463. doi: 10.3390/jof7060463, PMID: - DOI - PMC - PubMed
    1. Badaruddin M., Holcombe L. J., Wilson R. A., Wang Z. Y., Kershaw M. J., Talbot N. J. (2013). Glycogen metabolic genes are involved in trehalose-6-phosphate synthase-mediated regulation of pathogenicity by the rice blast fungus Magnaporthe oryzae. PLoS Pathog. 9:e1003604. doi: 10.1371/journal.ppat.1003604, PMID: - DOI - PMC - PubMed
    1. Bagchi S., Perland E., Hosseini K., Lundgren J., Al-Walai N., Kheder S., et al. . (2020). Probable role for major facilitator superfamily domain containing 6 (MFSD6) in the brain during variable energy consumption. Int. J. Neurosci. 130, 476–489. doi: 10.1080/00207454.2019.1694020, PMID: - DOI - PubMed
    1. Benjamini Y., Hochberg Y. (1995). Controlling the false discovery rate: a practical and powerful approach to multiple testing. J. R. Stat. Soc. B 57, 289–300. doi: 10.1111/j.2517-6161.1995.tb02031.x - DOI

LinkOut - more resources