. 2025 Jan 10;6(1):101148.
doi: 10.1016/j.patter.2024.101148.

PhosNetVis: A web-based tool for fast kinase-substrate enrichment analysis and interactive 2D/3D network visualizations of phosphoproteomics data

Affiliations

PhosNetVis: A web-based tool for fast kinase-substrate enrichment analysis and interactive 2D/3D network visualizations of phosphoproteomics data

Osho Rawal et al. Patterns (N Y). .

Abstract

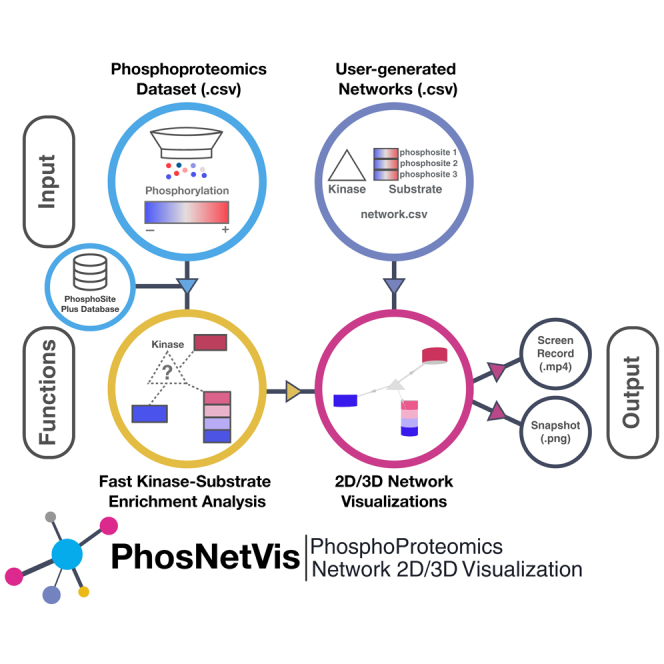
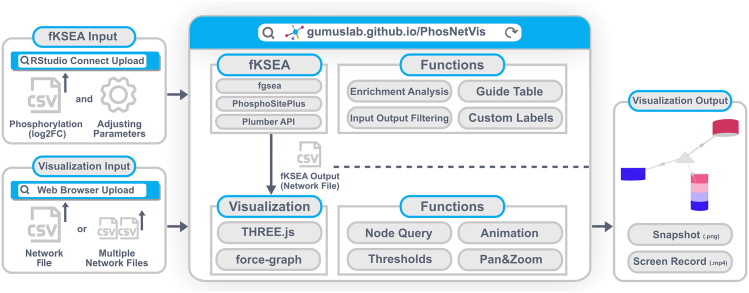
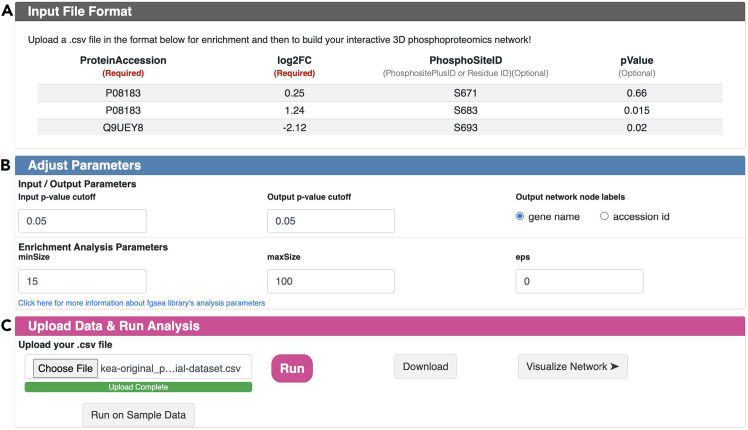
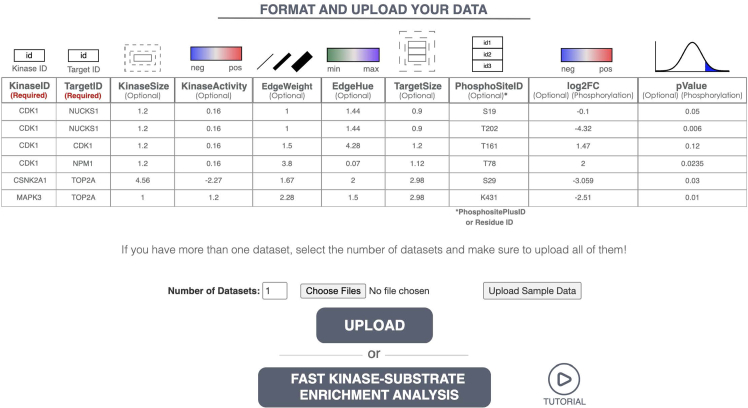
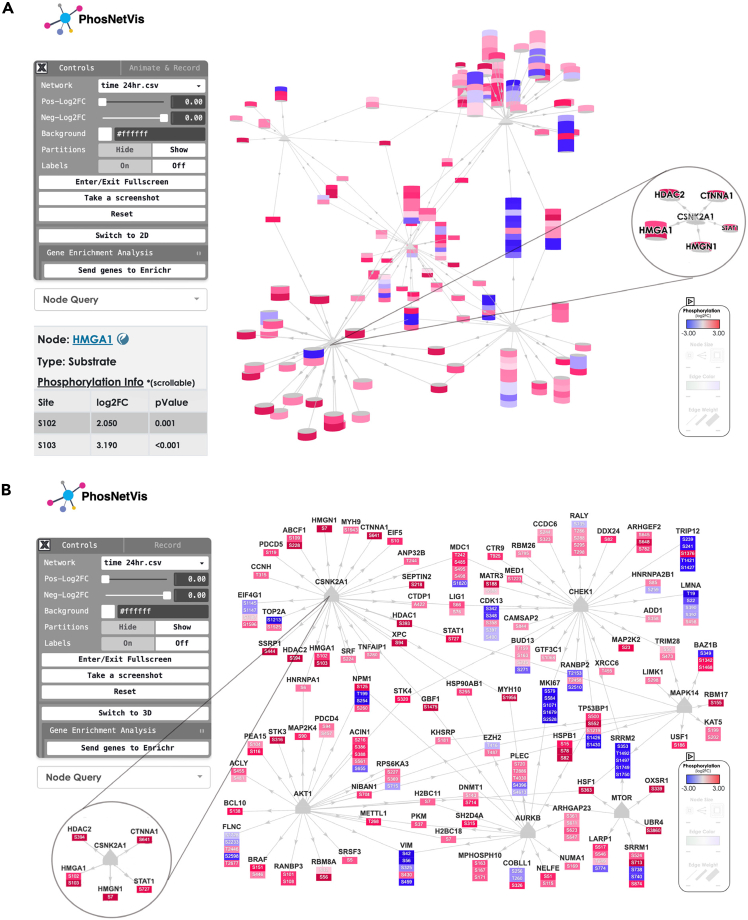
Protein phosphorylation involves the reversible modification of a protein (substrate) residue by another protein (kinase). Liquid chromatography-mass spectrometry studies are rapidly generating massive protein phosphorylation datasets across multiple conditions. Researchers then must infer kinases responsible for changes in phosphosites of each substrate. However, tools that infer kinase-substrate interactions (KSIs) are not optimized to interactively explore the resulting large and complex networks, significant phosphosites, and states. There is thus an unmet need for a tool that facilitates user-friendly analysis, interactive exploration, visualization, and communication of phosphoproteomics datasets. We present PhosNetVis, a web-based tool for researchers of all computational skill levels to easily infer, generate, and interactively explore KSI networks in 2D or 3D by streamlining phosphoproteomics data analysis steps within a single tool. PhostNetVis lowers barriers for researchers by rapidly generating high-quality visualizations to gain biological insights from their phosphoproteomics datasets. It is available at https://gumuslab.github.io/PhosNetVis/.

Keywords: 3D visualization; CPTAC; fast kinase-substrate enrichment analysis; interactive visualization; kinase-substrate interaction; network visualization; phosphoproteomics; phosphorylation.


Conflict of interest statement

S.G. reports other research funding from Boehringer-Ingelheim, Bristol-Myers Squibb, Celgene, Genentech, Regeneron, and Takeda and consulting for Taiho Pharmaceuticals not related to this study.

Figures

None
Graphical abstract
Figure 1
Figure 1
PhosNetVis overall architecture and main components
Figure 2
Figure 2
fKSEA page snapshot (A) The Input File Format section describes the input .CSV file format for fKSEA input. (B) The Adjust Parameters section enables users to adjust parameters based on their needs before running the FGSEA algorithm. (C) The Upload Data & Run analysis section enables users to upload their input file from their local directory, run fKSEA, download the generated KSI network file, and visualize the generated network.
Figure 3
Figure 3
Snapshot of the network visualization input page (descriptive text not shown) This page allows users to upload network files for visualization. Users can upload their custom network files or customize those generated by the fKSEA page. For comparative analyses across networks, users can upload multiple files by selecting the number of datasets they want to upload. This page also displays a table that provides the required network data format. To visualize network data, users need a .CSV file with at least two columns: (1) kinases (KinaseID) and (2) target nodes (TargetID) for substrates. Optionally, users can add columns to customize the node and edge attributes.
Figure 4
Figure 4
Snapshots of the network visualization interface featuring the phosphorylation landscape of SARS-CoV-2 infection This page allows users to view and interact with the network curated from the global phosphorylation landscape of SARS-CoV-2 infection (Bouhaddou et al.). Users can rotate the network, zoom in/out, pan through, see node information by double-clicking on it, or reset the view by double-clicking on the background. Additionally, it provides options for the user to switch between 3D or 2D networks. Users can also send their gene list to the Enrichr tool,, for gene enrichment analyses and further exploration of enriched pathways and functional gene groups. Double-clicking on any node opens an interactive table that displays detailed information about the node, as shown in (A), bottom left, for node HMGA1. (A) Snapshot of the 3D view of the network, including a magnified view of a CSNK2A1-central subnetwork in 3D. This subnetwork highlights phosphorylation sites known to be associated with cytoskeleton remodeling, filtered from the main network. (B) Snapshot of the 2D view of the same network. The left corner shows the control panel, the center displays the network, and the bottom right corner contains the legend. The starred section indicates the CSNK2A1 phosphorylation subnetwork, including a magnified view of the same CSNK2A1 node with select interactors in a subnetwork in 2D. These features enable comprehensive exploration and analysis of the phosphorylation events during SARS-CoV-2 infection.
Figure 5
Figure 5
Snapshots of interactive 2D network visualizations for CPTAC pan-cancer immune subtypes (A) Kinases and their specific altered phosphosites, phosphorylation levels, and positions in each altered substrate are clearly shown in the CD8+/IFNG+ network. The visualization clearly depicts upregulation of the global abundance of the kinase PRKACA (center) and the phospho-abundance of its substrates in red. (B) The CD8−/IFNG− subnetwork. The global proteomic expression of cell-cycle kinases such as CDK1 and the phospho-abundance of its substrates are upregulated and shown in red.

Update of

Similar articles

Cited by

References

    1. Hallal M., Braga-Lagache S., Jankovic J., Simillion C., Bruggmann R., Uldry A.-C., Allam R., Heller M., Bonadies N. Inference of kinase-signaling networks in human myeloid cell line models by Phosphoproteomics using kinase activity enrichment analysis (KAEA) BMC Cancer. 2021;21:789. doi: 10.1186/s12885-021-08479-z. - DOI - PMC - PubMed
    1. Piersma S.R., Valles-Marti A., Rolfs F., Pham T.V., Henneman A.A., Jiménez C.R. Inferring kinase activity from phosphoproteomic data: Tool comparison and recent applications. Mass Spectrom. Rev. 2022;43:725–751. doi: 10.1002/mas.21808. - DOI - PubMed
    1. Kuleshov M.V., Xie Z., London A.B.K., Yang J., Evangelista J.E., Lachmann A., Shu I., Torre D., Ma’ayan A. KEA3: improved kinase enrichment analysis via data integration. Nucleic Acids Res. 2021;49:W304–W316. doi: 10.1093/nar/gkab359. - DOI - PMC - PubMed
    1. Wiredja D.D., Koyutürk M., Chance M.R. The KSEA App: a web-based tool for kinase activity inference from quantitative phosphoproteomics. Bioinformatics. 2017;33:3489–3491. doi: 10.1093/bioinformatics/btx415. - DOI - PMC - PubMed
    1. Ochoa D., Jonikas M., Lawrence R.T., El Debs B., Selkrig J., Typas A., Villén J., Santos S.D., Beltrao P. An atlas of human kinase regulation. Mol. Syst. Biol. 2016;12 doi: 10.15252/msb.20167295. - DOI - PMC - PubMed

LinkOut - more resources