[Preprint]. 2025 Jan 24:2024.12.11.627873.
doi: 10.1101/2024.12.11.627873.

Mapping cell-cell fusion at single-cell resolution

Affiliations

Mapping cell-cell fusion at single-cell resolution

Andrea L Gardner et al. bioRxiv. .

Abstract

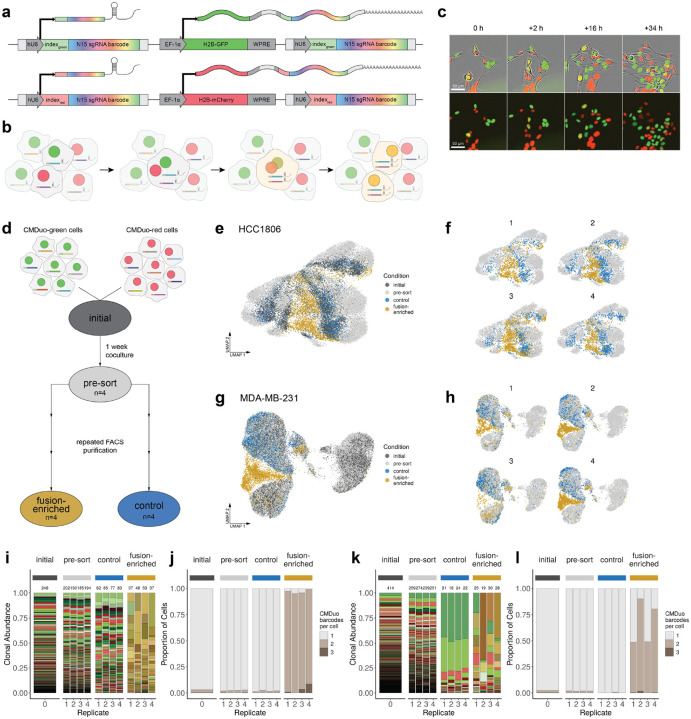
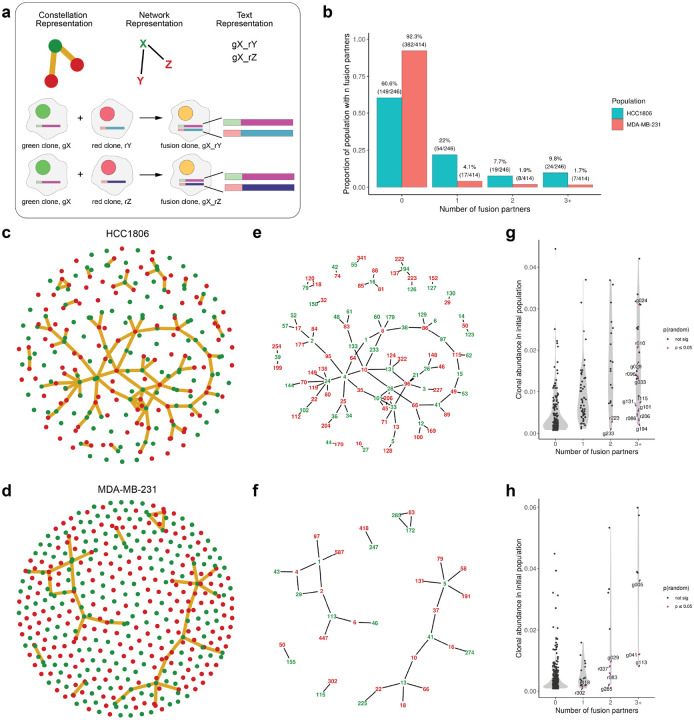
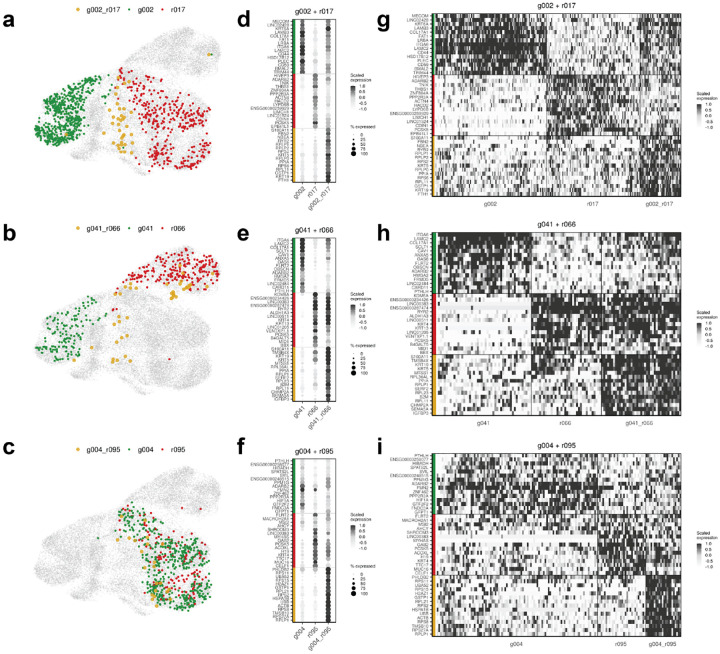
Cell-cell fusion is a tightly controlled process in the human body known to be involved in fertilization, placental development, muscle growth, bone remodeling, and viral response. Fusion between cancer cells results first in a whole-genome doubled state, which may be followed by the generation of aneuploidies; these genomic alterations are known drivers of tumor evolution. The role of cell-cell fusion in cancer progression and treatment response has been understudied due to limited experimental systems for tracking and analyzing individual fusion events. To meet this need, we developed a molecular toolkit to map the origins and outcomes of individual cell fusion events within a tumor cell population. This platform, ClonMapper Duo ('CMDuo'), identifies cells that have undergone cell-cell fusion through a combination of reporter expression and engineered fluorescence-associated index sequences paired to randomly generated nucleotide barcodes. scRNA-seq of the indexed barcodes enables the mapping of each set of parental cells and fusion progeny throughout the cell population. In triple-negative breast cancer cells CMDuo uncovered subclonal transcriptomic hybridization and unveiled distinct cell-states which arise in direct consequence of homotypic cell-cell fusion. CMDuo is a platform that enables mapping of cell-cell fusion events in high-throughput single cell data and enables the study of cell fusion in disease progression and therapeutic response.


Figures

Figure 1.
Figure 1.. ClonMapper Duo is a two-color, two-index expressed DNA barcoding platform which enables tracking of cell-cell fusion events in scRNA-seq and live-cell imaging.
(a) Schematic showing the core features of the CMDuo system. Cells with the integrated transgene express a barcode composed of a degenerate N(15) sequence with a 5-nt index sequence corresponding to the expressed fluorescent protein. The vector expresses the barcode as both a CRISPR-compatible sgRNA and a polyadenylated transcript. (b) Schematic following barcoded cells through cell-cell fusion, genomic recombination and division. Cells generated from cell-cell fusion of CMDuo-green and CMDuo-red cells will express barcodes and barcode-associated fluorescent proteins from both parental cells. (c) 10X live-cell imaging capture of a spontaneous cell-cell fusion event between CMDuo-red and CMDuo-green HCC1806 cells (additional images in Extended Data. Fig. 1). (d) 1:1 mixtures of homotypic CMDuo-green and CMDuo-red barcoded HCC1806 or MDA-MB-231 cells were cocultured in 5 independent replicates. One replicate was analyzed by scRNA-seq (“initial”) 2 days after plating. The remaining 4 replicates stayed in coculture for 1 week (“pre-sort”) before undergoing multiple rounds of FACS sorting to enrich for double-positive fusion events (“fusion-enriched”) or single positive (“control”) cells from each replicate for each cell line. (e) UMAP representation of scRNA-seq for all cells in the HCC1806 data set colored by sample and (f) shown for each replicate. (g) UMAP representation of scRNA-seq for all cells in the MDA-MB-231 data set colored by sample and (h) shown for each replicate. (i) Distribution of clones and (j) the number of barcodes assigned to each cell within each sample for HCC1806. Here a unique green, red, or gold/brown was assigned to each CMDuo-green, CMDuo-red, or fusion clone, respectively. (k) Distribution of clones and (l) the number of barcodes assigned to each cell within each sample for MDA-MB-231.
Figure 2.
Figure 2.. High-resolution mapping of cell-cell fusion events.
(a) Legend showing an overview of different representations of fusion events, here we show how a fusion event between green clone ‘gX’ and two different red clones ‘rY’ and ‘rZ’ can be represented as constellation plots, network plots, and in text. (b) Proportion of clones participating in fusion events in each cell line. (c) Constellation plot showing all clones with edges representing a fusion event between clones in the HCC1806 and (d) MDA-MB-231 populations. (e) Network representation highlighting the barcode identifiers for clones involved in cell-cell fusion events for HCC1806 and (f) MDA-MB-231. (g) Quantification of the number of fusion partners for each clone, highlighting clones which participated in fusion events more often than random chance given abundance in the initial population for the HCC1806 and (h) MDA-MB-231 populations.
Figure 3.
Figure 3.. Fusion progeny hybridize parental transcriptomic states and activate new programs.
Clone-to-clone analysis highlighting examples of 3 distinct fusion examples in the HCC1806 population: (top) g002+g017, (center) g041+r066, and (bottom) g004+r095. Showing for each (a-c) UMAP representations of each parent-parent-fusion set (d-f) average scaled expression of clone-specific marker genes for each clone in the parent-parent-fusion set where the intensity of the dot represents scaled expression and the size of the dot represents the number of cells of that clone expressing that gene, (g-i) scaled expression of clone-specific marker genes for each clone visualized across cells from each clone.
Figure 4.
Figure 4.. CMDuo reveals a distinct transcriptomic state driven by cell-cell fusion.
UMAP representations of all barcoded cells colored by CMDuo index (a-b) or (c-d) transcriptomic cluster in the HCC1806 population (see Extended Data Fig. 7 for parallel analysis on MDA-MB-231). (e) Percent of all confident fusion events in each transcriptomic cluster showing percent of all fusion cells (light) and percent of all fusion clones (dark). (f) Origin of parental cells in each transcriptomic cluster showing percent of parental cells (light) and percent of parental clones (dark). (g) Alluvial plot summarizing the relationships between parental transcriptomic clusters and fusion progeny transcriptomic cluster. (h) Pie chart representation of the proportion of each clone in each cluster for each set of parent-parent-fusion clones. (i) Heatmap showing marker gene expression for each cluster.
Figure 5.
Figure 5.. Differential expression and gene set enrichment analysis of fusion cells in cluster F versus fusion cells in other clusters.
(a) Volcano plot of differentially expressed genes in cluster F fusion cells (blue, right) vs. other cluster fusion cells (dark grey, left) for the HCC1806 and (b) MDA-MB-231 populations, highlighting the top genes differentially expressed in both cell lines. (c) Hallmark enrichment analysis showing pathways up or down in both cell lines, with positive NES scores matched to cluster F fusion cells and negative NES scores for fusion cells in other clusters. (d) GO biological process enrichment analysis showing pathways up or down in both cell lines.

References

    1. Marusyk A., Janiszewska M. & Polyak K. Intratumor Heterogeneity: The Rosetta Stone of Therapy Resistance. Cancer Cell 37, 471–484 (2020). - PMC - PubMed
    1. Morris L. G. T. et al. Pan-cancer analysis of intratumor heterogeneity as a prognostic determinant of survival. Oncotarget 7, 10051–10063 (2016). - PMC - PubMed
    1. Tasdogan A. et al. Metabolic heterogeneity confers differences in melanoma metastatic potential. Nature 577, 115–120 (2020). - PMC - PubMed
    1. Jhan J.-R. & Andrechek E. R. Triple-negative breast cancer and the potential for targeted therapy. Pharmacogenomics 18, 1595–1609 (2017). - PMC - PubMed
    1. Stewart R. L. et al. A Multigene Assay Determines Risk of Recurrence in Patients with Triple-Negative Breast Cancer. Cancer Res 79, 3466–3478 (2019). - PMC - PubMed

Publication types

LinkOut - more resources