[Preprint]. 2025 Jan 21:2025.01.21.634097.
doi: 10.1101/2025.01.21.634097.

Cholinergic dynamics in the septo-hippocampal system provide phasic multiplexed signals for spatial novelty and correlate with behavioral states

Affiliations

Cholinergic dynamics in the septo-hippocampal system provide phasic multiplexed signals for spatial novelty and correlate with behavioral states

Fatemeh Farokhi Moghadam et al. bioRxiv. .

Abstract

In the hippocampal formation, cholinergic modulation from the medial septum/diagonal band of Broca (MSDB) is known to correlate with the speed of an animal's movements at sub-second timescales and also supports spatial memory formation. Yet, the extent to which sub-second cholinergic dynamics, if at all, align with transient behavioral and cognitive states supporting the encoding of novel spatial information remains unknown. In this study, we used fiber photometry to record the temporal dynamics in the population activity of septo-hippocampal cholinergic neurons at sub-second resolution during a hippocampus-dependent object location memory task using ChAT-Cre mice. Using a general linear model, we quantified the extent to which cholinergic dynamics were explained by changes in movement speed, behavioral states such as locomotion, grooming, and rearing, and hippocampus-dependent cognitive states such as recognizing a novel location of a familiar object. The data show that cholinergic dynamics contain a multiplexed code of fast and slow signals i) coding for the logarithm of movement speed at sub-second timescales, ii) providing a phasic spatial novelty signal during the brief periods of exploring a novel object location, and iii) coding for environmental novelty at a seconds-long timescale. Furthermore, behavioral event-related phasic cholinergic activity around the onset and offset of the behavior demonstrates that fast cholinergic transients help facilitate a switch in cognitive and behavioral state before and during the onset of behavior. These findings enhance understanding of the mechanisms by which cholinergic modulation contributes to the coding of movement speed and encoding of novel spatial information.

Keywords: acetylcholine; encoding and retrieval; fiber photometry; hippocampal formation; medial septum; novel object location.


Figures

Figure 1.
Figure 1.. Experimental design.
A. Schematic drawing of the surgical approach taken to perform fiber photometry of cholinergic septo-hippocampal projection neurons using jGCaMP7/8 in freely-behaving ChAT-Cre mice. B. Schematic drawing of the fiber photometry system. C. Design of the object location memory (ObLoM) task. During the Sample phase (15 minutes), mice explored two identical objects in a 40 x 40 cm2 square arena with 30 cm high walls. During the Test phase (15 minutes), one of the two objects was moved to a novel location (Non-Stationary Object). The Sample and Test phases were separated by a 1-hour delay phase, during which the mouse was returned to its home cage (6 mice). Experiment was repeated as trial 2 in a counterbalanced design after 4-6 days (4 mice). D-G. Immunohistological verification of the optical fiber track position and cell type-specific expression of jGCaMP7/8 in cholinergic neurons of the MSDB. (D) Green color indicates jGCaMP7/8 fluorescence, (E) magenta color indicates immunolabeling of ChAT, a marker for cholinergic neurons. (F) White color indicates colocalization of jGCaMP7/8 fluorescence and ChAT immunostaining (Scale bar, 50 μm). (G) Histological confirmation of the fiber track position (yellow arrow points to tissue displaced by the implanted optical fiber) within the MSDB (Scale bar, 200 μm).
Figure 2.
Figure 2.. Cholinergic activity is linearly correlated to the logarithm of the animal’s movement speed during an object location-memory task.
A. Correlation between cholinergic activity, quantified as ΔF/F, and the animal’s movement speed, for one example session recorded during the Test phase. Signals are smoothed with a 1-second window; R, Pearson’s correlation coefficient. B. Scatter plot of cholinergic activity, quantified as ΔF/F, as a function of the animal's movement speed for an example session, with an exponential function fitted to the data (red). C. Z-scores of ΔF/F of cholinergic activity across all sessions as a function of the animal's movement speed (20 sessions). Speed is binned with a bin width of 1 cm/s. Data shown as mean ± s.e.m. D. Same data as in (A) but using the logarithm of the animal's movement speed. E. Same data as in (B) but using the logarithm of the animal's movement speed, with a linear function fitted to the data (red). F. Z-scores of ΔF/F of cholinergic activity across Test sessions (red, 10 sessions) and Sample sessions (blue, 10 sessions) as a function of the animal's movement speed. Speed is binned with a bin width of 0.2. Data shown as mean ± s.e.m. G. Mean ± s.e.m. of time scale-dependent Pearson correlation coefficient distributions between the smoothed cholinergic activity and the logarithm of the animal’s movement speed (20 sessions). H-I. Time-series data on movement speed and cholinergic activity, quantified as ΔF/F, from one example session (H) and averaged across all sessions (I). Time-series data are smoothed with a 1-second window for better illustration. Thick curves show the exponential fit to the data; τ = time constant of exponential fit. Data in (I) shown as mean ± s.e.m.; n = 20 sessions.
Figure 3.
Figure 3.. Mice recall the novel location of a non-stationary object in the ObLoM task.
A. DI for Sample (blue) and Test (red) sessions computed for 3-minute intervals using a sliding window. Data show mean ± s.e.m. B. Difference in DI between Test and Sample sessions computed for 3-minute intervals using a sliding window; *p = 0.008; n.s. = not significant; n = 10 sessions. C. (Top) Illustration of the object location memory task (ObLoM). (Bottom) Data on DI for Sample and Test sessions, computed from data on the first 12-min and 3-min, respectively. *p = 0.016; n =10. DI = discrimination Index.
Figure 4.
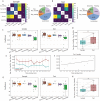
Figure 4.. Phasic cholinergic activity signals novelty of object locations and are correlated to behavioral states.
A. (Right) Average distribution and co-occurrence of time spent by animals in different behavioral states during Sample sessions (10 sessions). (Left) Pie charts display the percentage of each behavior relative to the others. B. Same as (a) but for Test sessions (10 sessions). C. Summary data comparing the effects of different behavioral states on cholinergic activity during Sample (left, 10 sessions) and Test (right, 10 sessions) sessions. Coefficients are extracted from general linear model (GLM) results; * Significantly different from zero. D. Differences in the effects of exploring non-stationary versus stationary objects on cholinergic activity during Test (red) and Sample (blue) sessions. Coefficients are extracted from GLM results; * Significantly different. E. Mean ± s.e.m. of the differences in the effect of object exploration on cholinergic activity, calculated over 3-minute intervals using a sliding window for Sample (blue, 10 sessions) and Test (red, 10 sessions) sessions. Coefficients are extracted from the applied GLM over 3-minute intervals, including only periods with at least 1 second of object exploration. F. Linear regression analysis of the differences in data shown in (E) between Test and Sample sessions. G. Same data as in (B) after normalizing by the effect of movement speed. H. Same data as in (E) after normalizing by the effect of movement speed.
Figure 5.
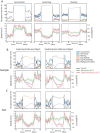
Figure 5.. Fast cholinergic transients across cognitive and behavioral states.
A. (Top Row) Occupancy ratios of behavioral states 5 s before the onset, during, and 5 s after the offset of locomotion, grooming, and rearing events. Only events with no occurrence of the behavioral state in question during the 4 s before or after the onset and offset were analyzed. Between the onset and offset of a behavioral state, data are plotted on a relative timescale. Different colors represent distinct behaviors: locomotion (blue), grooming (green), rearing (purple), exploratory behaviors associated with stationary objects (orange), exploratory behaviors associated with non-stationary objects (brown), and background (gray) indicating the absence of all other behaviors. (Bottom Row) Data on movement speed (black), observed cholinergic activity (green), and cholinergic activity predicted from movement speed (red). Data show mean ± s.e.m. Locomotion events, n = 47; Grooming events, n = 73; Rearing events, n = 85. Data from 6 mice. B. Data on exploring the stationary and non-stationary objects in the Sample session. Data are visualized in the same way as in (A). Exploring the stationary object, n = 32; exploring the non-stationary object, n = 27. C. Data on exploring the stationary and non-stationary objects in the Test session. Data are visualized in the same way as in (B). Exploring the stationary object, n = 20; exploring the non-stationary object, n = 17.

Similar articles

References

    1. DATAtab Team (2024). DATAtab: Online Statistics Calculator. DATAtab e.U. Graz, Austria. URL https://datatab.net
    1. Acquas E., Wilson C., Fibiger H.C., 1996. Conditioned and Unconditioned Stimuli Increase Frontal Cortical and Hippocampal Acetylcholine Release: Effects of Novelty, Habituation, and Fear. J. Neurosci. 16, 3089. 10.1523/JNEUROSCI.16-09-03089.1996 - DOI - PMC - PubMed
    1. Aloisi A.M., Casamenti F., Scali C., Pepeu G., Carli G., 1997. Effects of novelty, pain and stress on hippocampal extracellular acetylcholine levels in male rats. Brain Res. 748, 219–226. 10.1016/s0006-8993(96)01304-2 - DOI - PubMed
    1. Alonso A., Köhler C., 1984. A study of the reciprocal connections between the septum and the entorhinal area using anterograde and retrograde axonal transport methods in the rat brain. J. Comp. Neurol. 225, 327–343. 10.1002/cne.902250303 - DOI - PubMed
    1. Barry C., Heys J.G., Hasselmo M.E., 2012. Possible role of acetylcholine in regulating spatial novelty effects on theta rhythm and grid cells. Front. Neural Circuits 6. 10.3389/fncir.2012.00005 - DOI - PMC - PubMed

Publication types

LinkOut - more resources