[Preprint]. 2025 May 28:2025.01.21.634124.
doi: 10.1101/2025.01.21.634124.

ADAR1 haploinsufficiency and sustained picornaviral RdRp dsRNA synthesis synergize to dysregulate RNA editing and cause multi-system interferonopathy

Affiliations

ADAR1 haploinsufficiency and sustained picornaviral RdRp dsRNA synthesis synergize to dysregulate RNA editing and cause multi-system interferonopathy

Caitlin M Miller et al. bioRxiv. .

Update in

Abstract

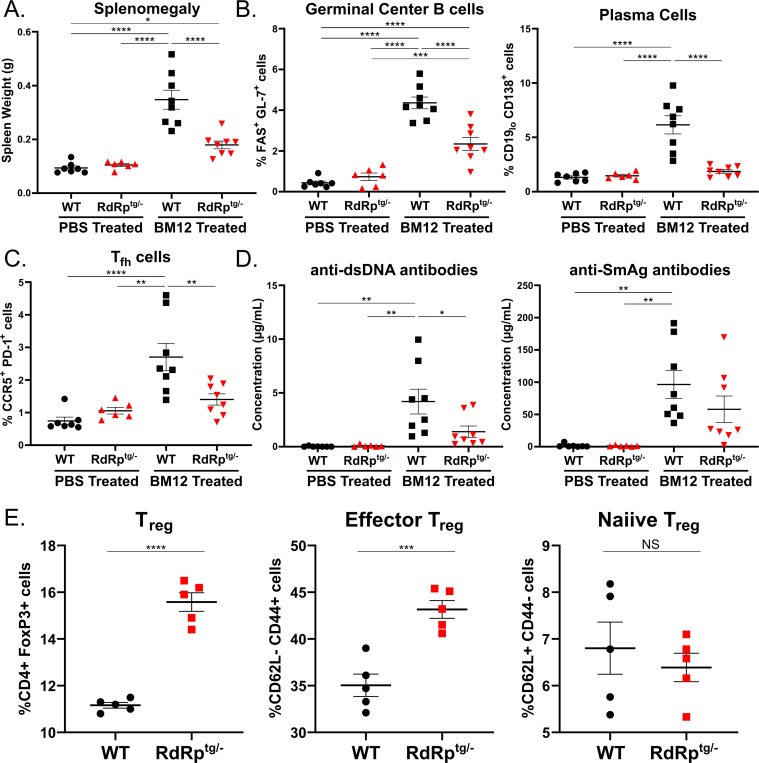
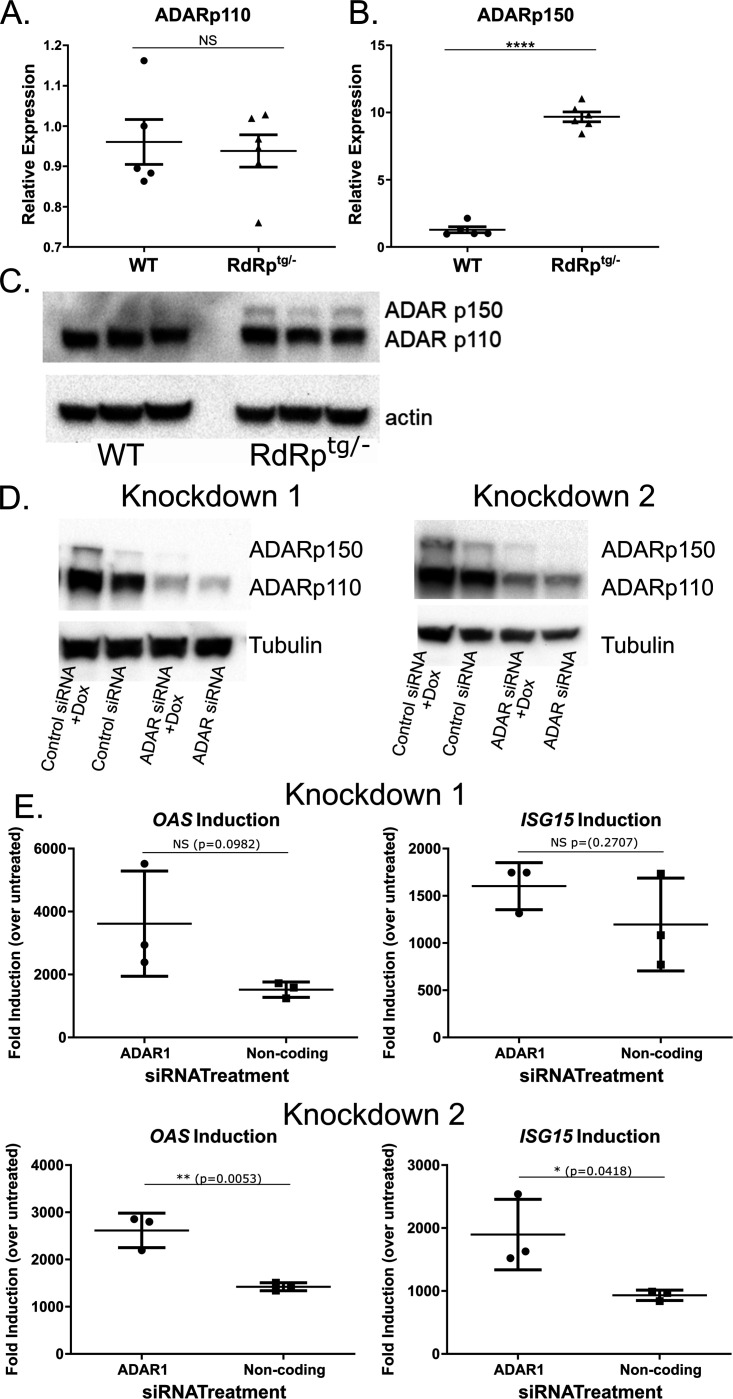
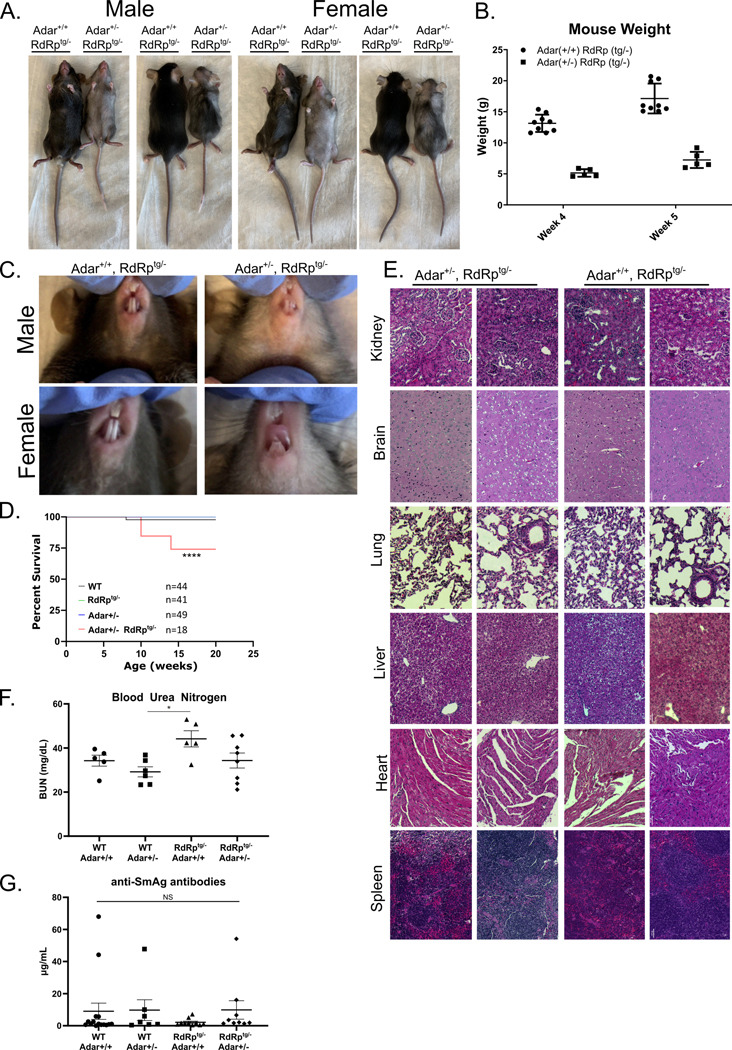
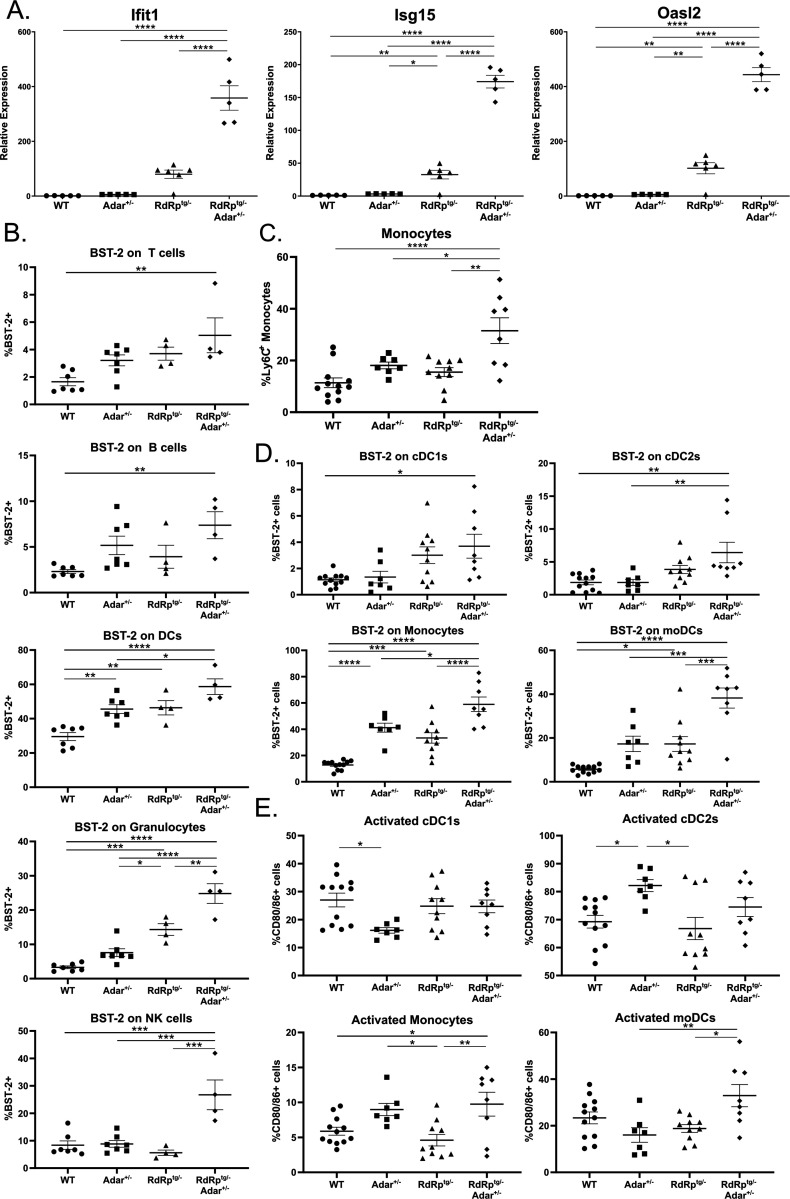
Sensing of viral double-stranded RNA by MDA5 triggers abundant but transient interferon-stimulated gene (ISGs) expression. If dsRNA synthesis is made persistent by transgenically expressing a picornaviral RNA-dependent RNA polymerase (RdRp) in mice, lifelong MDA5-MAVS pathway activation and marked, global ISG upregulation result. This confers robust protection from viral diseases but in contrast to numerous other chronic MDA5 hyperactivation states, the mice suffer no autoimmune or other health consequences. Here we find they further confound expectations by being resistant to a strong autoimmunity (lupus) provocation. However, knockout of one allele of Adar breaks the autoinflammation-protected state of RdRptg mice and results in a severe disease that resembles interferonopathies caused by MDA5 gain-of-function protein mutations. Adar +/- mice are healthy but Adar +/- RdRptg mice have shortened lifespan, stunted growth, premature fur graying, poorly developed teeth, skeletal abnormalities, and extreme ISG elevations. A-to-I edits are both abnormally distributed and increased (numbers of genes and sites). These results, with a nucleic acid-triggered and MDA5-wild type model, illuminate the ADAR1-MDA5 axis in the regulation of innate immunity and establish that viral polymerase-sourced dsRNA can drive autoinflammatory disease pathogenesis.

Keywords: ADAR1; MDA5; RdRp; autoimmunity; autoinflammation; innate antiviral immunity; interferonopathy; lupus; picornavirus.


Figures

Figure 1.
Figure 1.. RdRptg mice resist SLE-like disease induction in the BM12 model of lupus.
Ten-week-old mice were challenged with 100 million BM12-derived splenocytes. Mice were harvested 14 days post challenge for analyses. (A) Splenomegaly. Weights of BM12 and sham-injected mice spleens were measured. (B,C) Germinal center B cells, plasma cells and Tfh cells. RBC-lysed, single cell suspensions of splenocytes from BM12 or sham injected animals were generated for flow staining and germinal center B cells and plasma B cells (B), or follicular helper cell populations (C) were measured by flow cytometry according to gating described in materials and methods section. (D) Anti-nuclear antibodies. Sera from BM12 splenocyte-injected or sham injected mice were used to measure anti-dsDNA antibodies and anti-SmAg antibodies by quantitative ELISA. Data in A-D are from n = 7, 6, 8, 8 mice for WT (PBS), RdRptg/− (PBS), WT (BM12), and RdRptg/− (BM12) groups respectively. (E) Treg cells. RBC-lysed single cell suspensions were generated from spleens of untreated, ten-week-old WT or RdRptg mice (n = 5 for each group) and Treg subsets were determined by flow cytometry. Data were analyzed using one-way ANOVA followed by Tukey tests for (A-D) and an unpaired student’s T test for (E). * = p < 0.05, ** = p < 0.01, *** = p < 0.001, **** = p < 0.0001. Data points represent individual animals, graphs show means with standard deviations (s.d.).
Figure 2.
Figure 2.. ADAR p150 and ADAR p110 levels in RdRptg mice, and effects of ADAR knockdown on RdRp-dependent ISG expression.
RNA isolated from brains of 4 to 5 week old WT or RdRptg/− mice (n = 5 for WT, 6 for RdRptg/−) was used to measure (A) ADAR p110 and (B) ADAR p150 transcripts by qPCR. Data points represent individual animals, graphs shown means, s.d. (C) Immunoblotting for ADAR p110 and ADAR p150 in 4 to 5 week old mouse WT and RdRptg/− brain. n = 3 animals per genotype. (D) A549 cells with inducible Theiler’s virus RdRp (Tet-on system). Data are shown from two representative knockdowns. (E) RNAs isolated from the parallel knockdowns done in panel D were used for qPCR analysis to determine relative levels of the ISGs OAS and ISG15 mRNAs. mRNAs were harvested 54 hours after ADAR-targeting siRNA addition and 48 hours after dox addition. Comparisons were made between dox-treated and dox-untreated cells and expressed as fold mRNA changes induced by dox. Transfection controls (cells receiving transfection reagents but no siRNA) showed similar levels of ISG induction after dox treatment as control siRNA-transfected cells, indicating lack of contribution of transfected siRNAs to immune activation. Data are means and s.d. of triplicate biological replicates with three technical replicates each. NS: not significant; * = p < 0.05, ** = p < 0.01, **** = p < 0.0001; unpaired Student’s T test.
Figure 3.
Figure 3.. Phenotypic and histological differences in RdRptg/− Adar+/− mice.
(A) Size and coat color differences in 5-week-old, littermate RdRptg/− and RdRptg/− Adar+/− mice. (B) Weight differences between 4 week and 5-week-old littermate RdRptg/− and RdRptg/− Adar+/− mice (n = 9 and 5 respectively). (C) Dental developmental differences between RdRptg/− and RdRptg/− Adar+/− mice. (D) Survival of animals from each group, followed for 20 weeks and shown as Kaplan-Meier plot. (E) H & E-stained tissue sections from kidney, brain, lung, liver, heart and spleens from RdRptg/− and RdRptg/− Adar+/− littermate mice. Pathological grading revealed no significant scoring in RdRptg/−Adar+/− animals. (F) Blood Urea nitrogen from serum from 4–5 week old animals in WT, Adar+/−, RdRptg/−, Adar+/−RdRptg/− mice. n = 5, 6, 5, 8 for WT, Adar+/−, RdRptg/−, Adar+/− RdRptg/−, respectively. (G) Anti-SmAG antibodies from serum from 4–5 week old animals as measured by quantitative ELISA. Four outlier high values were seen, but two were in the WT group. n = 15, 7, 10, 9 for WT, Adar+/−, RdRptg/−, Adar+/− RdRptg/−, respectively. Anti-dsDNA antibody levels from matched serum was below the limit of detection for all animals tested. Where not indicated, all data and tissue sections come from a mix of male and female mice. Data in (B) were analyzed by two-way ANOVA where ****p < 0.0001. Data in D were analyzed using a log-rank test (Mantel-Cox) where **** = p < 0.0001. Data in (F) and (G) were analyzed by one-way ANOVA where *p < 0.05; data points represent individual animals, graphs show means and s.d.
Figure 4.
Figure 4.. Skeletal and dental features of wild type, RdRptg/−, Adar+/−, and Adar+/− RdRptg/− mice.
Femurs from 6-week-old animals were manually de-fleshed and used for all analyses. (A) Femur lengths of WT, Adar+/−, RdRptg/−, and RdRptg/− Adar+/− mice (n = 8, 6, 10, and 17 animals respectively). (B) Representative μCT images, distal femur sections and whole bone. (C) Cortical bone volume fraction (BV/TV), n = 8, 7, 10, 17. (D) Trabecular number, n = 8, 7, 9, 17. (E) Trabecular separation, n = 8, 7, 9, 17. (F) Stiffness, n = 8, 7, 10, 15. (G) Maximum load, n = 8, 7, 10, 17. (H) Cortical total mineral density, n = 8, 7, 10, 17. (I) Modulus, n = 8, 7, 10, 17. (J) Ultimate stress, n = 8, 7, 10, 17. Mice with gray fur are indicated by light-blue symbols. Data were analyzed first by using a ROUT test to remove outliers (Q = 1%), which resulted in removal of two mice from one group in one panel (the RdRptg/− Adar+/− group in Fig. 4F, stiffness testing; hence there are 15 mice as opposed to the 17 for this genotype in the other panels). A one-way ANOVA comparing RdRptg/− Adar+/− to each other group was used followed by a Tukey tests where * = p < 0.05, ** = p < 0.01, *** = p < 0.001, **** = p < 0.0001. Data points represent individual animals, horizontal bars indicate means.
Figure 5.
Figure 5.. RNA-seq analysis reveals clear pattern of ISG upregulation suggestive of an interferonopathy.
RNA-seq from neuronal tissue from n = 4 age-matched (5 weeks) mice per group. Where possible, littermate controls were used for analysis. Two male and two female mice were used per group. (A) Multi-dimensional scaling plot of RNA expression profiles in WT-WT, Adar+/−, RdRptg/−, and RdRptg/− Adar+/− mice. (B) Heatmap of differentially expressed ISGs across the four genotypes (Fig. S3 shows an enlarged version with gene names annotated). FPKM values were log transformed with 1 pseudocount to facilitate visualization. (C) Summary table of differentially expressed genes (DEGs) and proportions of which are known ISGs as determined by the Interferome database. (D) Differentially expressed genes that are shared across all group comparisons. (E) RdRp mRNA abundance in the four genotypes. (F) Canonical molecular pathways from IPA that are significant across group comparisons.
Figure 6.
Figure 6.. ISG and leukocyte subset differences in RdRptg/− Adar+/− mice.
(A) qPCR of three representative ISGs (Ifit1, Isg15, and Oasl2) in brain tissue of 4–5 week old WT, Adar+/−, RdRptg/, and RdRptg/− Adar+/− mice (n = 5, 5, 6, 5, respectively). (B-E) Flow cytometry analysis of cellular populations derived from the spleens of 4–5 week old mice. Single cell, RBC-lysed solutions were prepared for use in analysis. (B) BST-2 expression on the main immune cell subsets in the spleen including T cells (CD3+), B cells (CD19+), DCs (CD11c+), granulocytes (Ly6G+), and NK cells (NKp46+). n = 7, 7, 4, 4 for WT, Adar+/−, RdRptg/, RdRptg/− Adar+/−, respectively. (C) Monocytes populations across all four groups. (D) BST-2 expression on monocyte/DC cell subsets including monocytes, cDC1s, cDC2s, and moDCs. (D) Activation (CD80/86 expression) of monocyte/DC subsets including monocytes, cDC1s, cDC2s, and moDCs. C-E: n = 12, 7, 10, 8 for WT, Adar+/−, RdRptg/, RdRptg/− Adar+/−, respectively. For all graphs shown, data were analyzed using a one-way ANOVA followed by a Tukey tests to determine significance where * = p < 0.05, ** = p < 0.01, *** = p < 0.001, **** = p < 0.0001. Data points represent individual animals with the mean and s.d. shown as bars.
Figure 7.
Figure 7.. Analysis of the A-to-I editome reveals increased editing in RdRptg/− Adar+/− mice.
Changes in A-to-I edits were determined via comparison of RNA-seq data with whole exome DNA sequencing. (A) Pie charts showing the proportion of editing sites within a given RNA element for each mouse genotype. (B) Table summary of the distribution of overall numbers of edited genes and sites for each genotype and the breakdown of locations of the edit sites among different RNA elements. For each of the four genotypes, four animals were sequenced and to be counted a gene must have been edited in all four animals sequenced but editing can occur anywhere in the gene. For sites, identical sites must be edited in all four animals of a genotype. (C) Venn diagrams showing overlap of edited genes (top) or sites (bottom) among the four genotypes. (D,E) Immunoblot analysis from two animals per group (D) and gene expression fold change (E) of three Adar+/− RdRptg/− uniquely edited genes in the RNA-seq data set (as compared to WT) in 5-week-old neuronal tissue. Rig-I, Isg15, and Zbp1 were evaluated as they are each ISGs that are highly upregulated in mice expressing RdRp and are key regulators of the antiviral response. (F) Expression of Adar isoforms in neuronal tissue of 4–5 week old mice from all four genotypes, as determined by western blot (n = 2 per group).

References

    1. Rehwinkel J, Gack MU. 2020. RIG-I-like receptors: their regulation and roles in RNA sensing. Nat Rev Immunol 20:537–551. - PMC - PubMed
    1. Hornung V, Ellegast J, Kim S, Brzozka K, Jung A, Kato H, Poeck H, Akira S, Conzelmann KK, Schlee M, Endres S, Hartmann G. 2006. 5’-Triphosphate RNA is the ligand for RIG-I. Science 314:994–7. - PubMed
    1. Kato H, Takeuchi O, Mikamo-Satoh E, Hirai R, Kawai T, Matsushita K, Hiiragi A, Dermody TS, Fujita T, Akira S. 2008. Length-dependent recognition of double-stranded ribonucleic acids by retinoic acid-inducible gene-I and melanoma differentiation-associated gene 5. J Exp Med 205:1601–10. - PMC - PubMed
    1. del Toro Duany Y, Wu B, Hur S. 2015. MDA5-filament, dynamics and disease. Curr Opin Virol 12:20–5. - PMC - PubMed
    1. Dias Junior AG, Sampaio NG, Rehwinkel J. 2019. A Balancing Act: MDA5 in Antiviral Immunity and Autoinflammation. Trends Microbiol 27:75–85. - PMC - PubMed

Publication types