[Preprint]. 2025 Jan 24:2025.01.20.633920.
doi: 10.1101/2025.01.20.633920.

Epigenetic dysregulation of metabolic programs mediates liposarcoma cell plasticity

Affiliations

Epigenetic dysregulation of metabolic programs mediates liposarcoma cell plasticity

Erica M Pimenta et al. bioRxiv. .

Abstract

Sarcomas are rare connective tissue cancers thought to arise from aberrant mesenchymal stem cell (MSC) differentiation. Liposarcoma (LPS) holds valuable insights into dysfunctional differentiation given its well- and dedifferentiated histologic subtypes (WDLPS, DDLPS). Despite well-established differences in histology and clinical behavior, the molecular pathways underlying each subtype are poorly understood. Here, we performed single-nucleus multiome sequencing and spatial profiling on carefully curated human LPS samples and found defects in adipocyte-specific differentiation within LPS. Loss of insulin-like growth factor 1 (IGF1) and gain of cellular programs related to early mesenchymal development and glucagon-like peptide-1 (GLP-1)-induced insulin secretion are primary features of DDLPS. IGF1 loss was associated with worse overall survival in LPS patients. Through in vitro stimulation of the IGF1 pathway, we identified that DDLPS cells are deficient in the adipose-specific PPARG isoform 2 (PPARG2). Defects in IGF1/PPARG2 signaling in DDLPS led to a block in differentiation that could not be fully overcome with the addition of exogenous IGF1 or the pro-adipogenic agonists to PPARG and GLP-1. However, we noted upregulation of the IGF1 receptor (IGF1R) in the setting of IGF1 deficiency, which promoted sensitivity to an IGF1R-targeted antibody-drug conjugate that may serve as a novel therapeutic strategy in LPS. In summary, lineage-specific defects in adipogenesis drive dedifferentiation in LPS and may translate into selective therapeutic targeting in this disease.


Figures

Figure 1.
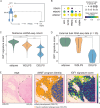
Figure 1.. Transcriptomic analysis of WDLPS and DDLPS patient samples.
(A) Schematic of the snRNA-seq analysis of LPS multiome cohort: UMAP of integrated snRNA-seq data subsetted to 80,881 tumor cells for downstream analysis, nuclei colored by LPS subtype. (B) Representative gene set enrichment plots of robustly enriched (as defined by BEANIE) gene sets in WDLPS (W) relative to DDLPS (D). (C)UMAP of unintegrated tumor cells as cNMF input colored by LPS subtype pathology (left). UMAP of tumor cells colored by relative usage of cNMF-derived cellular programs ‘Early development’ (middle) and ‘Insulin-mediated adipogenesis’ (right). (D) Violin plot of normalized usages of the cNMF programs in (C) colored by LPS subtype. *** p<0.001 by Mann-Whitney U test.
Figure 2.
Figure 2.. Epigenetic analysis of LPS patient tumors.
(A) Schematic of epigenetic analysis of LPS snATAC-seq cohort. UMAP of subsetted 8,873 adipocytes and LPS tumor cells, colored by pathology. (B) Left, number of differentially accessible peaks per pathology and a heatmap of relative accessibility of top 250 statistically significant peaks per group. Right, top 5 significantly enriched pathways by pathology. (C) Coverage plot over IGF1 gene body by pathology. Regions highlighted in light gray are statistically significant results when using the FindAllMarkers function; regions highlighted by black arrows are significant using FindMarkers function on WDLPS and DDLPS cells only, both using logistic regression adjusted for sequencing depth. Significance defined as adjusted p value < 0.05 by logistic regression. Candidate response elements (CREs) denoted by orange bars. (D) Multiome tumor cell RNA-seq UMAP showing scaled relative IGF1 expression (left) and tumor cell pathology (right).
Figure 3.
Figure 3.. IGF1 expression and LPS patient outcomes.
(A) Bar graphs of relative mean expression values of IGF1 per patient in DDLPS (blue, top) and WDLPS (orange, bottom) samples, in ascending order of expression. If a patient had two samples in the cohort, sample IGF1 expression values were averaged. Boxes signify whether the patient has died, had recurrent LPS (gray), or has remained disease free for > 5 years (red). (B) TCGA bulk RNA-seq data comprising 58 patients with DDLPS and one patient with WDLPS was assessed for overall survival based on IGF1 expression greater than the median expression value for the cohort (‘high’) or less than (‘low’) the median. Kaplan-Meier analysis curves (top) and number at risk (bottom). Statistical significance determined by log-rank test.
Figure 4.
Figure 4.. IGF1 signaling in patient LPS samples.
(A) Model of adipocyte-specific autocrine IGF1 signaling. (B) Dotplot depicting scaled mean expression and percent of cells with detectable expression for each gene by LPS subtype within snRNA-seq data of multiome cohort. (C) IGF1 signaling gene signature scored within the snRNA-seq data colored by pathology. (D) IGF1 gene signature scored within external bulk RNA-seq LPS data colored by pathology. E. Spatial transcriptomic analysis of FFPE section of WDLPS/DDLPS transition zone. Left, H&E image of assessed 6.5 × 6.5 mm tissue section, LPS subtype (WDLPS, left and DDLPS, right) demarcated by dashed line. Middle, cNMF usage program with highest score assigned to each spot, colored by program name. Right, IGF1 signaling gene signature score per spot, visualized using a color scale spanning from the 10th to the 90th percentile of the calculated score, where the minimum value corresponds to the 10th percentile and the maximum to the 90th percentile *** p < 0.001 by Mann-Whitney U test.
Figure 5.
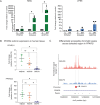
Figure 5.. PPARG isoform expression in distinct differentiation states in vitro and in LPS patient tissue samples.
(A) Expression of PPARG1, PPARG2, and ADIPOQ in MSCs before (control, gray) and after exposure to IGF1+DM (DM, green). On the right, expression of PPARG1, PPARG2, and ADIPOQ in LPS6 cells before (C, gray) and after IGF1+DM exposure (DM, blue). Gene expression levels are fold change delta-delta CT, normalized to beta-actin and relative to control for each cell line. Statistical significance determined by Student’s t-test. * p < 0.05. (B) Expression of PPARG1 (top) and PPARG2 (bottom) in human adipose (green, n = 3), WDLPS (orange, n = 6), and DDLPS (blue, n = 10) tissue samples (total n = 19; 12 samples are derived from adjacent tissue of tumors sequenced in multiome cohort, augmented by 7 additional patient samples). PPARG2 transcript was not detected in one WDLPS and two DDLPS samples. Statistical significance defined as p < 0.05 by Kruskal Wallis. (C) Coverage plot over selected region of PPARG gene body containing differentially accessible peaks (light gray) in the snATAC-seq multiome data, colored by LPS subtype. Peaks deemed significantly differentially accessible between WDLPS and DDLPS cells by logistic regression, adjusted for sequencing depth. Significance defined as adjusted p value < 0.05. Promoter-like signature region (‘Promoter’) denoted by the red bar. PPARG2 transcription start site indicated by arrow.
Figure 6.
Figure 6.. IGF1R-ADC in vitro cytotoxicity.
(A) Immunofluorescence (IF) image of 93T449 cells illustrating membranous localization of IGF1R (green), highlighted by the white arrow. Phalloidin is shown in red and nuclear staining (DAPI) in blue. (B) 93T449 cells and (C) Human aortic endothelial cells (HAECs) were exposed to increasing concentrations (0–10 μg/ml) of anti-IGF1R or isotype control antibody conjugated to MMAE (IGF1R-ADC or Isotype control-ADC, respectively) in complete cell culture media for 72 hours. Cell viability was determined by XTT assay, setting 0 μg/ml isotype control as 100% viability.

References

    1. Tap W. D., Wagner A. J., Schöffski P., Martin-Broto J., Krarup-Hansen A., Ganjoo K. N., Yen C.-C., Abdul Razak A. R., Spira A., Kawai A., Le Cesne A., Van Tine B. A., Naito Y., Park S. H., Fedenko A., Pápai Z., Soldatenkova V., Shahir A., Mo G., Wright J., Jones R. L., ANNOUNCE Investigators, Effect of Doxorubicin Plus Olaratumab vs Doxorubicin Plus Placebo on Survival in Patients With Advanced Soft Tissue Sarcomas: The ANNOUNCE Randomized Clinical Trial. JAMA 323, 1266–1276 (2020). - PMC - PubMed
    1. Savina M., Le Cesne A., Blay J. Y., Ray-Coquard I., Mir O., Toulmonde M., Cousin S., Terrier P., Ranchere-Vince D., Meeus P., Stoeckle E., Honore C., Sargos P., Sunyach M. P., Le Pechoux C., Giraud A., Bellera C., Le Loarer F., Italiano A., Patterns of care and outcomes of patients with METAstatic soft tissue SARComa in a real-life setting: the METASARC observational study. BMC Med 15, 78 (2017). - PMC - PubMed
    1. Singer S., Antonescu C. R., Riedel E., Brennan M. F., Histologic subtype and margin of resection predict pattern of recurrence and survival for retroperitoneal liposarcoma. Ann Surg 238, 358–70; discussion 370–1 (2003). - PMC - PubMed
    1. Amin-Mansour A., George S., Sioletic S., Carter S. L., Rosenberg M., Taylor-Weiner A., Stewart C., Chevalier A., Seepo S., Tracy A., Getz G., Hornick J. L., Nucci M. R., Quade B., Demetri G. D., Raut C. P., Garraway L. A., Van Allen E. M., Wagner A. J., Genomic Evolutionary Patterns of Leiomyosarcoma and Liposarcoma. Clin Cancer Res 25, 5135–5142 (2019). - PMC - PubMed
    1. Hirata M., Asano N., Katayama K., Yoshida A., Tsuda Y., Sekimizu M., Mitani S., Kobayashi E., Komiyama M., Fujimoto H., Goto T., Iwamoto Y., Naka N., Iwata S., Nishida Y., Hiruma T., Hiraga H., Kawano H., Motoi T., Oda Y., Matsubara D., Fujita M., Shibata T., Nakagawa H., Nakayama R., Kondo T., Imoto S., Miyano S., Kawai A., Yamaguchi R., Ichikawa H., Matsuda K., Integrated exome and RNA sequencing of dedifferentiated liposarcoma. Nat Commun 10, 5683 (2019). - PMC - PubMed

Publication types

LinkOut - more resources