[Preprint]. 2025 Jan 23:2025.01.22.634302.
doi: 10.1101/2025.01.22.634302.

Integrative Mapping of Pre-existing Immune Landscapes for Vaccine Response Prediction

Affiliations

Integrative Mapping of Pre-existing Immune Landscapes for Vaccine Response Prediction

Stephanie Hao et al. bioRxiv. .

Update in

Abstract

Predicting individual vaccine responses remains a significant challenge due to the complexity and variability of immune processes. To address this gap, we developed immunaut, an open-source, data-driven framework implemented as an R package specifically designed for all systems vaccinologists seeking to analyze and predict immunological outcomes across diverse vaccination settings. Leveraging one of the most comprehensive live attenuated influenza vaccine (LAIV) datasets to date - 244 Gambian children enrolled in a phase 4 immunogenicity study - immunaut integrates humoral, mucosal, cellular, transcriptomic, and microbiological parameters collected before and after vaccination, providing an unprecedentedly holistic view of LAIV-induced immunity. Through advanced dimensionality reduction, clustering, and predictive modeling, immunaut identifies distinct immunophenotypic responder profiles and their underlying baseline determinants. In this study, immunaut delineated three immunophenotypes: (1) CD8 T-cell responders, marked by strong baseline mucosal immunity and extensive prior influenza virus exposure that boosts memory CD8 T-cell responses, without generating influenza virus-specific antibody responses; (2) Mucosal responders, characterized by pre-existing systemic influenza A virus immunity (specifically to H3N2) and stable epithelial integrity, leading to potent mucosal IgA expansions and subsequent seroconversion to influenza B virus; and (3) Systemic, broad influenza A virus responders, who start with relatively naive immunity and leverage greater initial viral replication to drive broad systemic antibody responses against multiple influenza A virus variants beyond those included in the LAIV vaccine. By integrating pathway-level analysis, model-derived contribution scores, and hierarchical decision rules, immunaut elucidates how distinct immunological landscapes shape each response trajectory and how key baseline features, including pre-existing immunity, mucosal preparedness, and cellular support, dictate vaccine outcomes. Collectively, these findings emphasize the power of integrative, predictive frameworks to advance precision vaccinology, and highlight immunaut as a versatile, community-available resource for optimizing immunization strategies across diverse populations and vaccine platforms.


Conflict of interest statement

Competing interests: Authors declare that they have no competing interests. Florian Krammer (FK) declares the following conflicts of interest. The Icahn School of Medicine at Mount Sinai has filed patent applications regarding influenza virus vaccines on which FK is listed as inventor. The Icahn School of Medicine at Mount Sinai has filed patent applications relating to SARS-CoV-2 serological assays, NDV-based SARS-CoV-2 vaccines, influenza virus vaccines, and influenza virus therapeutics, which list FK as co-inventor, and FK has received royalty payments from some of these patents. Mount Sinai has spun out a company, Kantaro, to market serological tests for SARS-CoV-2 and another company, Castlevax, to develop SARS-CoV-2 vaccines. FK is a co-founder and scientific advisory board member of Castlevax. FK has consulted for Merck, GSK, Sanofi, Curevac, Seqirus, and Pfizer and is currently consulting for 3rd Rock Ventures, Gritstone, and Avimex. The Krammer laboratory is also collaborating with Dynavax on influenza vaccine development and with VIR on influenza virus therapeutics.

Figures
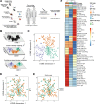
Figure 1.
Figure 1.. Immune response landscape mapping of LAIV reveals distinct immunophenotypic groups.
(A) Cohort overview depicting all features that were used for unsupervised ML approach: 244 children (24–59 months) vaccinated with LAIV, with mucosal and blood samples collected on day 0 (baseline) and day 21 (post-vaccination) to capture vaccine-induced immune responses by accounting for pre-existing immune status (fold-change). (B) Workflow schematic for automated clustering pipeline for immune landscape generation, applying t-SNE dimensionality reduction, K-nearest neighbors (KNN) graph construction, and Louvain community detection to identify distinct immunophenotypic clusters. The dataset is first reduced to a two-dimensional space using t-SNE to retain local similarities while capturing high-dimensional data structure generating a vaccine response landscape for each individual. A KNN graph is then constructed to capture local data relationships in this reduced space. Louvain clustering is applied to the KNN graph, optimizing community modularity by maximizing intra-cluster density. To ensure map stability, multiple clustering resolutions are iteratively tested and evaluated using a combined score based on modularity, silhouette score, Davies-Bouldin index (DBI), and Calinski-Harabasz index (CH), selecting the best clustering configuration based on these metrics. (C) Clustered t-SNE plot of fold-change data (post/pre-LAIV) revealing three LAIV response phenotypes (perplexity: 30; exaggeration factor: 4; max iterations: 10,000; theta: 0; eta: 500; K: 60; silhouette score: 0.40). (D, E) Each panel highlights clustering patterns according to specific demographic and response factors; (D) Clustering by sex (male in orange and female in green) (E) Clustering by study year (2017 in green and 2018 in orange). (F) Heatmap and hierarchical clustering display fold-change (FC) data for each cluster, scaled from −1 to 1. Clustering uses Euclidean distance and Ward’s D2 method, with cluster ordering optimized for visual clarity.
Figure 2.
Figure 2.. Vaccine response immune signatures defining LAIV responder types.
(A) Polar plot summarizing scaled median expression of key immune features in CD8 T-cell responders (Group 1, green). CD8 T-cell responders are characterized by robust influenza B virus HA-specific CD8+ IFNγ responses and limited humoral immunity, with median feature values represented in the polar plot and fold-change comparisons shown in the adjacent box plot. (B) Polar plot for mucosal responders (Group 2, orange), illustrating strong mucosal IgA responses, particularly stalk-specific (cH7/3 IgA) and H3N2 virus HA-specific IgA antibodies and influenza B virus-specific responses. Box plots detail fold changes (shown as log10) for various immune features, highlighting systemic (influenza B virus HAI) and mucosal immune activation (IgA). (C) Polar plot depicting systemic, broad influenza A virus responders (Group 3, purple), showing elevated systemic antibody responses to multiple influenza A virus strains (e.g., H1, H3), as well as cross-reactive IgG and ADCC (antibody-dependent cellular cytotoxicity) activity. Box plots show fold-change values (log10) for each immune marker across responder groups. (D) Integrated radar plot comparing scaled median immune expression profiles across all responder groups (CD8 T-cell responders in green, mucosal responders in orange, systemic broad influenza A virus responders in purple), emphasizing distinct immune feature distributions. This integrative visualization highlights the unique baseline and post-vaccination immune landscapes that define each responder profile. Box plots denote min to max values, points are all individuals within the group, with significance levels calculated using one-way ANOVA Kruskal-Wallis test with Dunn’s multiple comparison test to adjust for multiple testing. Significance is indicated as follows: ns = not significant, *p < 0.05, **p < 0.01, ***p < 0.001, ****p < 0.0001.
Figure 3.
Figure 3.. Automated machine learning framework for mapping and predicting LAIV immunogenicity response phenotypes.
(A) Overview of the automated ML framework developed to predict LAIV response phenotypes using baseline immune data from mucosal and blood samples, capturing multi-dimensional immune parameters such as transcriptomics, antibody titers, bacterial load, flu-specific T-cell responses, and comprehensive immunophenotyping. (B) Step 1. Balanced data partitioning: the dataset is split into training (80%) and testing (20%) sets, ensuring proportional representation of each immunophenotypic group (CD8 T-cell, mucosal, and systemic, broad influenza A responders) to maintain predictive accuracy across classes. Step 2. Model optimization cycle: 10-fold cross-validation and hyperparameter tuning are applied across 141 machine learning models, each iteratively trained and validated to identify the best predictors of vaccine response. Step 3. Model evaluation and scoring: predictive performance metrics, including specificity, sensitivity, and area under the curve (AUC), are calculated on the test set (20%) for model validation. Feature importance scores are computed for each baseline variable, providing a ranked analysis of each immune parameter’s contribution to LAIV response prediction. (C) Multi-class ROC plot of the gbm model evaluated on the test set (20%), displaying predictive accuracy across all three classes: CD8 T-cell responders (green), mucosal responders (orange), and systemic, broad influenza A responders (purple) in a one-vs-all comparison. (D) Variable importance score table for the gbm model, showcasing the cumulative importance of the selected baseline features across the three predicted classes, highlighting the most influential parameters in LAIV immunogenicity prediction.
Figure 4.
Figure 4.. Baseline immune landscape and viral shedding profiles predictive of LAIV response groups.
(A) Heatmap of baseline immune features predictive of LAIV response groups, organized by hierarchical clustering to show feature relationships and variations across groups (Euclidean distance, Ward’s D2 clustering method). Each cell reflects a scaled expression level, with red representing high expression and blue indicating low expression, revealing the distribution of immune features at baseline across the identified immunophenotypic clusters. (B) The proportion of seropositive children (HAI titer ≥10) at baseline (before vaccination) within each responder group and across all three LAIV-strains, pH1N1, H3N2, and influenza B virus (B). (C) The proportion of children that shed LAIV-strains (pH1N1, H3N2 and B) on day 2 and day 7 post-vaccination across all three responder groups. (D) Box plots showing baseline features, including H3N2 HAI geometric mean titer (gmt), titer of antibodies binding H3 HA from A/Switzerland/9715293/2013 analyzed by influenza virus protein microarray (H3 HA SWISS IVPM), titer of antibodies binding NA from group 2 (N2) and frequency of influenza B virus HA-specific CD8 T cells producing IFNγ across all three responder groups. CD8 T-cell responders (green), mucosal responders (orange) and systemic, broad influenza A virus responders (purple). Box plots denote min to max values, and points are all individuals within the group, with significance levels calculated using one-way ANOVA Kruskal-Wallis test with Dunn’s multiple comparison test to adjust for multiple testing. Significance is indicated as follows: ns = not significant, *p < 0.05, **p < 0.01, ***p < 0.001, ****p < 0.0001.
Figure 5.
Figure 5.. Baseline immune features and pathway-level determinants of LAIV responder profiles.
(A-C) Polar plots illustrating scaled median expression of immune pathways across three responder groups: (A) CD8 T-cell responders (Group 1, green); (B) mucosal responders (Group 2, orange); and (C) systemic, broad influenza A virus responders (Group 3, purple). (D) Combined radar plot showing integrated immune pathway signatures across the three responder groups, highlighting inter-group differences in pathway activation. (E) SHAP (SHapley Additive exPlanations) summary plots showing the contribution of baseline features to model predictions for each responder group (CD8 T-cell responders, group 1, green; mucosal responders, group 2, orange; and systemic, broad influenza A virus responders, group 3, purple). The intercept represents the baseline prediction before feature contributions. All other factors include the combined effect of features not displayed in the top 10 contributors. Prediction (purple bar) is the final probability derived by summing the intercept, top 10 feature contributions, and all other factors. Feature impacts are color-coded: green (positive, 1) increases the likelihood of belonging to the group, and red (negative, −1) decreases it. The top 10 features are ranked by their contribution to the prediction, providing insights into key drivers of LAIV response profiles. (F) The decision tree depicts the splits made at each node based on immune feature thresholds. Splits are chosen to maximize class separation, with fitted class probabilities displayed as group 1 (CD8 T-cell responders, green), group 2 (mucosal responder, orange) and group 3 (systemic, broad influenza A virus responders, purple) for each terminal node. The coverage percentage represents the proportion of observations falling under each rule. Nodes are labeled with thresholds and the conditions that define group separation, with terminal nodes representing the predicted group and associated probabilities.

Similar articles

References

    1. Plotkin S.A. & Plotkin S.L. The development of vaccines: how the past led to the future. Nature reviews. Microbiology 9, 889–893 (2011). 10.1038/nrmicro2668 - DOI - PubMed
    1. Hagan T., Nakaya H.I., Subramaniam S. & Pulendran B. Systems vaccinology: Enabling rational vaccine design with systems biological approaches. Vaccine 33, 5294–5301 (2015). 10.1016/j.vaccine.2015.03.072 - DOI - PMC - PubMed
    1. Pulendran B. & Davis M.M. The science and medicine of human immunology. Science 369 (2020). 10.1126/science.aay4014 - DOI - PMC - PubMed
    1. Tomic A., Pollard A.J. & Davis M.M. Systems Immunology: Revealing Influenza Immunological Imprint. Viruses 13 (2021). 10.3390/v13050948 - DOI - PMC - PubMed
    1. Sridhar S., Brokstad K.A. & Cox R.J. Influenza Vaccination Strategies: Comparing Inactivated and Live Attenuated Influenza Vaccines. Vaccines (Basel) 3, 373–389 (2015). 10.3390/vaccines3020373 - DOI - PMC - PubMed

Publication types