[Preprint]. 2025 Jan 24:2025.01.20.633986.
doi: 10.1101/2025.01.20.633986.

Generative modeling for RNA splicing predictions and design

Affiliations

Generative modeling for RNA splicing predictions and design

Di Wu et al. bioRxiv. .

Abstract

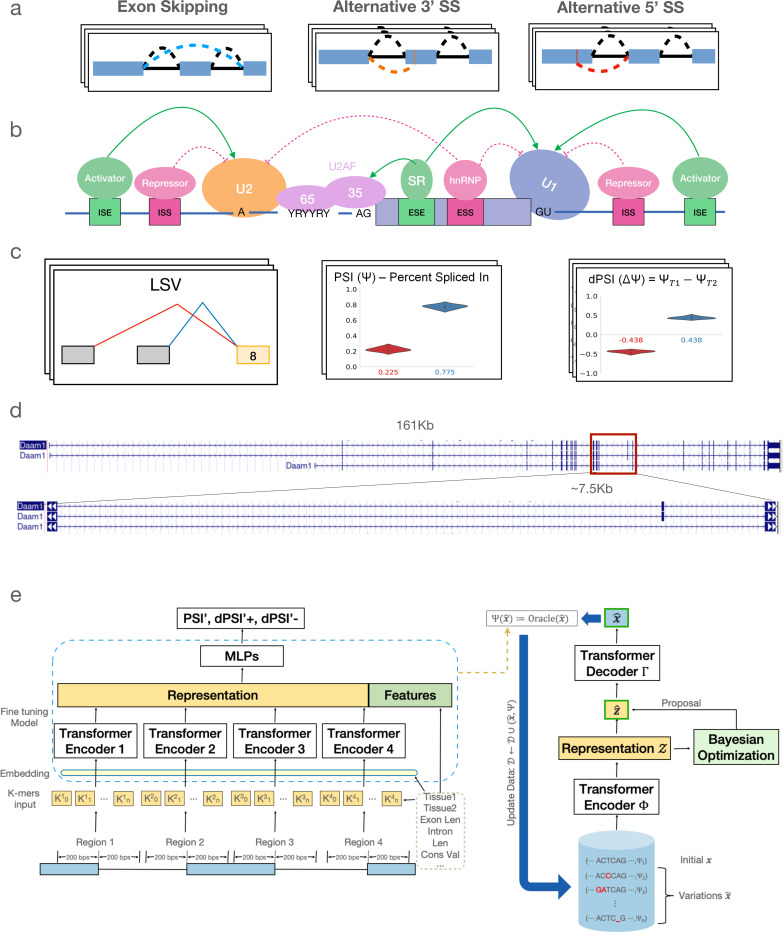
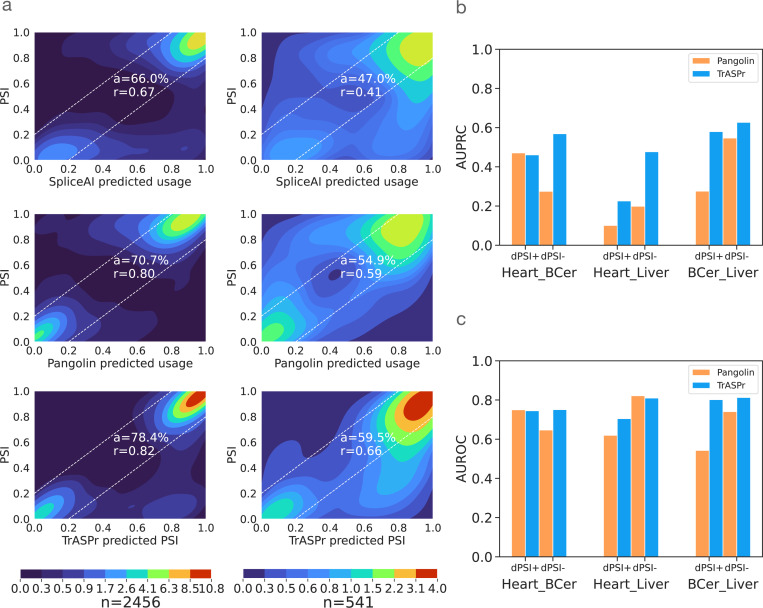
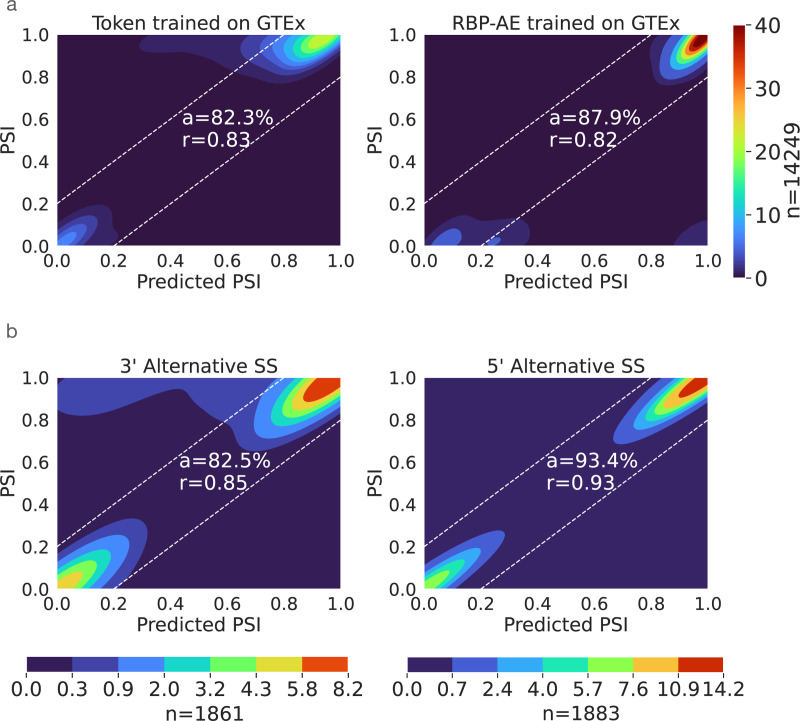
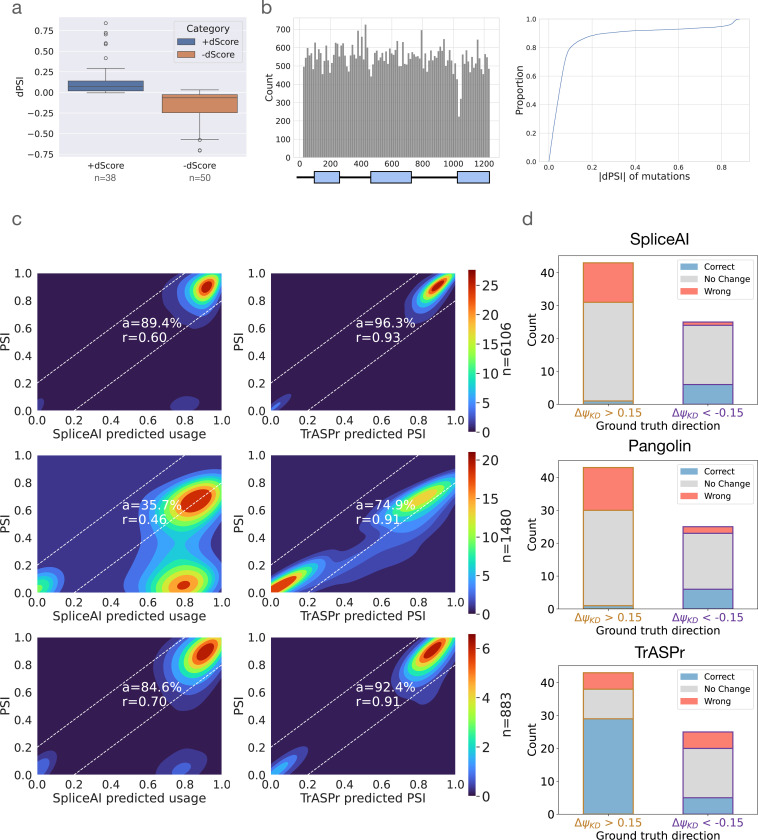
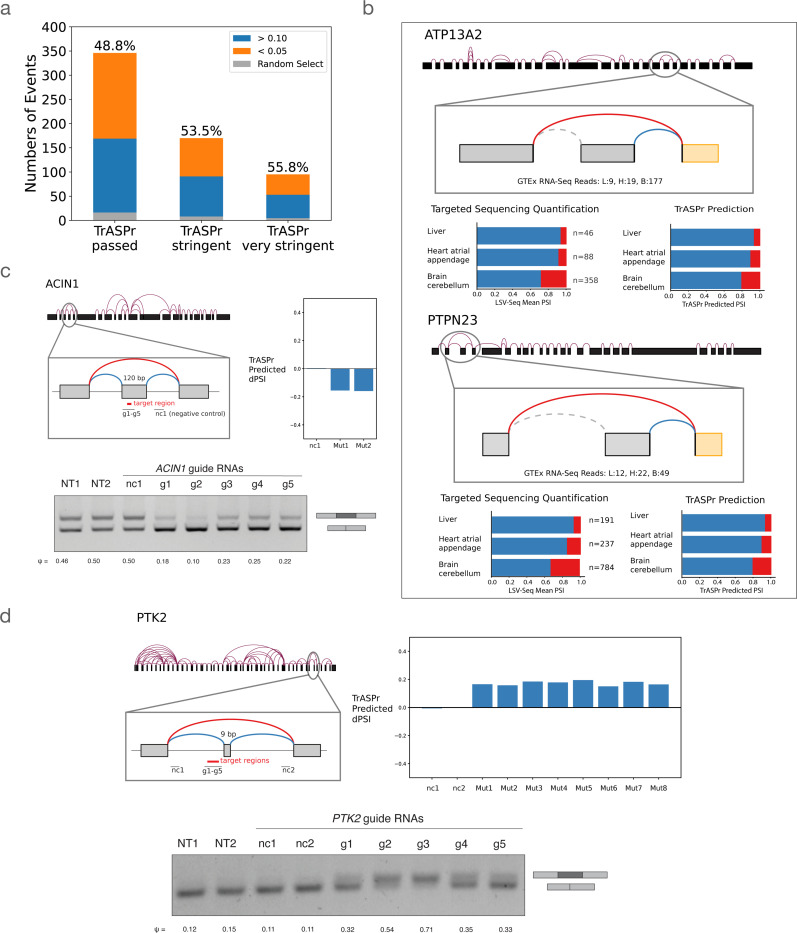
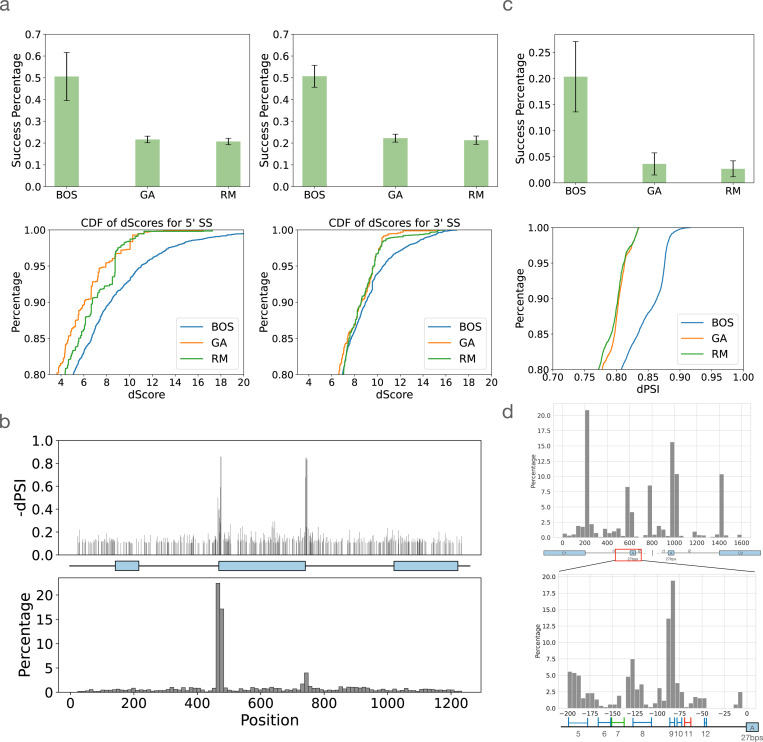
Alternative splicing (AS) of pre-mRNA plays a crucial role in tissue-specific gene regulation, with disease implications due to splicing defects. Predicting and manipulating AS can therefore uncover new regulatory mechanisms and aid in therapeutics design. We introduce TrASPr+BOS, a generative AI model with Bayesian Optimization for predicting and designing RNA for tissue-specific splicing outcomes. TrASPr is a multi-transformer model that can handle different types of AS events and generalize to unseen cellular conditions. It then serves as an oracle, generating labeled data to train a Bayesian Optimization for Splicing (BOS) algorithm to design RNA for condition-specific splicing outcomes. We show TrASPr+BOS outperforms existing methods, enhancing tissue-specific AUPRC by up to 2.4 fold and capturing tissue-specific regulatory elements. We validate hundreds of predicted novel tissue-specific splicing variations and confirm new regulatory elements using dCas13. We envision TrASPr+BOS as a light yet accurate method researchers can probe or adopt for specific tasks.


Conflict of interest statement

Competing Interests: The authors declare that they have no competing financial interests.

Figures

Appendix Figure 1.
Appendix Figure 1.
SpliceTransformer prediction results for GTEx dataset. Left is for all data samples and the right is for changing cases only.
Appendix Figure 2.
Appendix Figure 2.
Ablation study. Left column (TrASPr) is the full model with pre-trained transformers. noPre - Same structure and input as TrASPr but trained from scratch. noFeat - same train/pretrain as TrASPr but without extra features. wLSTM - model with a bidirectional LSTM instead of Transformer and without the extra features. nodPSI - remove dPSIs in target function.
Appendix Figure 3.
Appendix Figure 3.
Prediction results for TrASPr with token tissue representation when both training and testing on ENCODE+GTEx dataset.
Appendix Figure 4.
Appendix Figure 4.
CD19 mutagenesis data results for Pangolin. Pangolin was re-trained and tested with the same data as TrASPr shown in the main text.
Appendix Figure 5.
Appendix Figure 5.
Prediction results of TrASPr compared to ground truth PSI on ENCODE dataset
Appendix Figure 6.
Appendix Figure 6.
Generated sequences result for Daam1 gene exon 16, aimed to reduce inclusion in N2A cell line (dPSI>0.2) but not totally destroy the inclusion in other tissues(PSI>0.1)
Appendix Figure 7.
Appendix Figure 7.
(a) Pearson correlation between gene expression (TPM) and splice site usage as defined by SpliceTranformer using GTEX Brain Cerebellum (r = 0.52, left) and liver (r = 0.53, right). (b) Correlation is further improved when considering the expression of only the isoforms that contain a specific splice site (cerebellum r = 0.71, Liver r = 0.69 right). TPM was computed using SALMON, only splice junctions from chromosome 8 were included to save on compute time.
Appendix Figure 8.
Appendix Figure 8.
Tissue PSI values in GTEX samples (top - Cerebellum, bottom - liver) vs. SpliceTransformer usage. Correlation between usage and PSI is weak (Pearson r = 0.076 for Cerebellum, r = 0.074 for liver). Only shown are cassette exon PSI in chromosome 8 which were quantified by MAJIQ with high confidence and used as test data for all algorithms in the main text Fig2. When usage is high (left panels) PSI has the typical bimodal distribution such that it can either be very high or very low. Conversely, when PSI is low coverage can greatly vary between 0.05 (the threshold filter set by the SpliceTransformer authors) and 1 but when PSI is high the events are detected in almost all samples (usage close to 1).
Appendix Figure 9.
Appendix Figure 9.
Differential usage (x-axis) vs. differential splicing (dPSI, y-axis) for cassette exons in chromosomes 7,8 assessed for the three GTEX tissue pairs used in the main text (Fig2): Heart_BCer, Heart_Liver, BCer_Liver. dPSI values are the same as those used to train and test all algorithms in the main text. Top: Scatter plot Bottom: matching heat map. Note that ∼ 80–90% of the samples with dPSI > 0.1 have dUsage ∼ 0 and therefore will not be captured by the SpliceTransformer target function which weighs samples by their dUsage. A few points exhibit high dUsage and high dPSI contributing to some correlation, with pearson correlation ranging from 0 to 0.14 depending on the tissue pair.
Figure 1.
Figure 1.
RNA alternative Splicing (AS) and its predictive generative modeling. (a) Basic types of AS. (b) Schematic of components involved in RNA splicing and its regulation. (c) Quantification of exon skipping events from RNA-Seq. PSI is used to represent their inclusion level, and dPSI is used to show the inclusion change across different conditions. (d) A genome browser view of an illustrative exon skipping event. The genomic regions spanned by cassette exons varies from tens to hundreds of thousands of bases. (e) The structure and flow of TrASPr and BOS. See main text for details.
Figure 2.
Figure 2.
Comparison of PSI prediction results on GTEx dataset. (a) Heatmaps show the distribution of prediction vs. RNA-Seq values for all samples(left) and changing event samples(right) for SpliceAI (top), Pangolin (mid), and TrASPr (bottom). r is Pearson correlation, a is the proportion of predictions apprxomimately correct (within the dashed lines). (b) AUPRC for predicting events that are differentially included (dPSI+) or exlcuded (dPSI-) between two tissues. The tissue pair is denoted at the bottom, including Heart-Atrial Appendage, Brain-Cerebellum, and Liver. (c) Same as b above but for AUROC.
Figure 3.
Figure 3.
TrASPr prediction results in unseen conditions and alternative splice sites. (a) TrASPr was trained on GTEx 6 tissues and then tested on two cell lines in ENCODE (HepG2, K562). Left: The tissues were first represented as tokens, and new cell line results were predicted based on the average over conditions during training. Right: TrASPr used the RBP-AE learned representation to predict AS in the two ENCODE cell lines it never trained on. (b) Prediction accuracy of TrASPr when applied to alternative alternative 3’ (left) and alternative 5’ (right) splice sites.
Figure 4.
Figure 4.
TrASPr prediction results on mutation effect. (a) Whisker plot for splice site mutation effect on predicted PSI when weak splice sites are made strong (blue, left) and when strong splice sites are made weak (brown, right). (b) Distribution of mutation positions in CD19 dataset (left) and the CDF of the marginal effect per each of those positions (right). (c) Heatmaps showing the performance of SpliceAI (left column) and TrASPr (right column) in predicting the effect of mutations shown in b, under two three settings: random 5-fold cross-validation (top row), random 5-fold cross-validation for changing mutations only (middle row), and single unseen mutation filter (bottom row). n indicates the number of cases in the test set. (d) Predicting the effect (dPSI direction) of RBPs KD by mutating their corresponding sequence motifs. Blue, grey, and red correspond to correct, no change, and opposite direction prediction, respectively.
Figure 5.
Figure 5.
Experimental validations for TrASPr predictions. (a) Bar plot for the validation rate of low coverage AS events predicted by TrASPr to exhibit tissue-specific splicing between Brain-Cerebellum, Liver, and Heart-Atrial Appendage. Validation rate was between 48.8% to 55.8%, depending on the prediction stringency, discovering a total of 169 new tissue specific events. (b) Two examples of newly found tissue specific AS events from (a). For each case, the top graph illustrates the splicing context of the event. Two bar plots show the comparison between LSV-seq experimental results(bottom left) and TrASPr predictions(bottom right). (c)(d) Two AS events where specific regions were targeted by dCas13d including elements predicted by TrASPr to have significant regulatory effect and negative control regions. The bar plot(top right) shows the predicted inclusion level changes by TrASPr for 6b long windows in the tested region. Effects of dCas13d targeting were assessed by RT-PCR (bottom, NT = non-targeting, nc = negative control).
Figure 6.
Figure 6.
RNA design results by BOS (a) Results for the task of improving inclusion of weak cassette exons (n=8 exons). Top: Bar plots for success rate in achieving desired design task (increased inclusion). Error bars represent standard deviation over the set of exons tested. Bottom: CDFs over the best designed sequences (top 20%) by the MaxEnt splice site score change between the original sequence and proposed sequence. GA - Genetic Algorithm, RM - Random. (b) BOS generation results for CD19 mutation dataset. The positions mutated by BOS (bottom) capture regions close to the alternative exon splice sites whose mutations have strong marginal effects on inclusion levels (top). (c) Comparison of BOS, GA and RM on tissue-specific(Brain-Cerebellum) sequence generation. Different start sequences (n=10) are randomly chosen from cassette exons exhibiting low inclusion levels. Every algorithm is tasked with adopting the start sequence to achieve Brain-Cerebellum-specific high-inclusion (Ψ0.5 for Cerebellum, otherwise Ψ0.2) within 30 edits. Top: Success rate for this task. Bottom: The achieved improvement (dPSI) for the top 20% sequences generated by each algorithm. (d) BOS generation results for neuronal specific Daam1 exon 16. Bar plots indicate the distribution of hits where BOS mutated. The bottom plot is the zoom-in region of the top one. Regions that were validated experimentally by mutating them in a mini-gene systems are marked either blue (yes) or red (no) depending if TrASPr that teaches BOS is able to predict the effect of those segments. The green region indicates a region that doesn’t affect the inclusion level and is predicted correctly by TrASPr.

Similar articles

References

    1. Avsec Ž, Agarwal V, Visentin D, Ledsam JR, Grabska-Barwinska A, Taylor KR, Assael Y, Jumper J, Kohli P, Kelley DR. Effective gene expression prediction from sequence by integrating long-range interactions. Nature methods. 2021; 18(10):1196–1203. - PMC - PubMed
    1. Barash Y, Calarco JA, Gao W, Pan Q, Wang X, Shai O, Blencowe BJ, Frey BJ. Deciphering the splicing code. Nature. 2010; 465(7294):53–59. - PubMed
    1. Barash Y, Vaquero-Garcia J, González-Vallinas J, Xiong HY, Gao W, Lee LJ, Frey BJ. AVISPA: a web tool for the prediction and analysis of alternative splicing. Genome biology. 2013; 14:1–8. - PMC - PubMed
    1. Bend R, Cohen L, Carter MT, Lyons MJ, Niyazov D, Mikati MA, Rojas SK, Person RE, Si Y, Wentzensen IM, et al. Phenotype and mutation expansion of the PTPN23 associated disorder characterized by neurodevelopmental delay and structural brain abnormalities. European Journal of Human Genetics. 2020; 28(1):76–87. - PMC - PubMed
    1. Bepler T, Berger B. Learning the protein language: Evolution, structure, and function. Cell systems. 2021; 12(6):654–669. - PMC - PubMed

Publication types