[Preprint]. 2025 Jan 22:2025.01.20.633875.
doi: 10.1101/2025.01.20.633875.

STAT3 phosphorylation in the rheumatoid arthritis immunological synapse

Affiliations

STAT3 phosphorylation in the rheumatoid arthritis immunological synapse

Hila Novak Kotzer et al. bioRxiv. .

Update in

Abstract

Targeting the JAK/STAT pathway has emerged as a key therapeutic strategy for managing Rheumatoid Arthritis (RA). JAK inhibitors suppress cytokine-mediated signaling, including the critical IL-6/STAT3 axis, thereby effectively targeting different aspects of the pathological process. However, despite their clinical efficacy, a subset of RA patients remains refractory to JAK inhibition, underscoring the need for alternative approaches. Here, we identify a novel JAK-independent mechanism of STAT3 activation, which is triggered by the formation of the immunological synapse (IS) in naïve CD4+ T cells. Our data demonstrates that Lck mediates the TCR-dependent phosphorylation of STAT3 at the IS, highlighting this pathway as a previously unrecognized hallmark of early T cell activation. Furthermore, we show that the synaptic Lck/TCR-STAT3 pathway is compromised in RA. This discovery highlights a new therapeutic target for RA beyond JAK inhibitors, offering potential avenues for treating patients resistant to current therapies.

Keywords: CD4 T cells; Immunological synapse; Jak inhibitors; Lck; Rheumatoid arthritis; STAT3.


Conflict of interest statement

7.CONFLICT OF INTEREST DECLARATION This work was supported in part by a Research Agreement with Cue Biopharma for basic research on cytokine signalling pathways in the immunological synapse. AJ and MLD are founders at Granza Bio.

Figures

Figure 1.
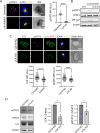
Figure 1.. STAT3 is activated in CD4+ and CD45RA+CD4+ T-cells after TCR stimulation.
(A) CD4+ T-cells are exposed to the SLB, containing His-tagged anti-CD3 and ICAM-1. (B) Representative confocal 3D stacks showing CD4+ T-cells forming a contact with SLBs. Samples stained for pSTAT3. (C) Representative TIRF images of CD4+ T-cells forming a contact with SLBs. Plot shows pSTAT3 mean fluorescence intensity (MFI). Data is the mean +/− SE (n=55 cells from 3 independent donors); *p<0.05, Mann-Whitney test. (D) Representative TIRF images of CD45RA+CD4+ T-cells introduced into SLBs containing anti-CD3 and ICAM-1 and stained for pSTAT3. (E) CD4+ and CD45RA+CD4+ T-cells were activated (a-CD3) or not (CTR) with anti-CD3 coated beads for 20 min and total STAT3 and pSTAT3 protein expression were measured by Western blot. (F) CD4+ and CD45RA+CD4+ T-cells were activated (Dyna) or not (CTR) with Dynabeads. After 20 min, pSTAT3 expression was measured by Flow Cytometr. pZAP70 was used as a positive control for TCR activation. (G) CD4+ and CD45RA+CD4+ T-cells were activated (Dyna) or not (CTR) with Dynabeads for the indicated timepoints before protein extraction and analysis by Western blot. STAT3 and β-actin were used as loading controls for Western Blots on samples run in parallel.
Figure 2.
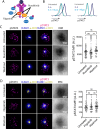
Figure 2.. TCR-dependent activation of STAT3 is mediated by Lck.
(A) (Left) TIRF images of CD45RA+CD4+ T-cells exposed to SLBs (ICAM1 and a-CD3). Cells were pre-treated, or not, for 30 min with Lck inhibitor (A-770041, Axon Medchem, 10μM). (Right) Quantification of pSTAT3 MFI. Data is the mean +/− SE (n=30 cells); ****p<0.0001, Mann-Whitney test. (B) Western Blot analysis of CD45RA+CD4+ T-cells treated or not (CTR) with beads coated with antiCD3/CD28 for 20 min. When indicated, cells were treated with Lck inhibitors. pSTAT3 and total STAT3 immunoblots were run in parallel and analyzed in relation to loading controls (C) (Top) TIRF images of LCK Knock-out (KO) CD45RA+CD4+ T-cells forming synapses with SLBs (ICAM1 and a-CD3). CD19 KO, negative control. Samples were stained for Lck and pSTAT3. (Bottom) Quantification of Lck and pSTAT3 MFI. Data is the mean ± SE (n>90 cells for 3 donors); ****p<0.0001, Mann-Whitney test. (D) KO CD45RA+CD4+ T-cells were treated with Dynabeads for 20 min and total protein expression was analyzed by Western Blot. Plots show quantification of total Lck protein expression normalized by β-actin and total pSTAT3 protein expression normalized by total STAT3. Data was relativized to CD19 KO. Data are the mean ± SE from 3 donors; *p<0.05, one-tailed Student’s t-test.
Figure 3.
Figure 3.. TCR-dependent activation of STAT3 is not mediated by Jak.
(A) Cartoon representing the IL-6 receptor signaling pathway. Ruxolitinib inhibits both Jak1 and Jak2, filgotinib preferentially inhibits Jak1. (B) CD4+ T-cells were treated or not with 25 ng/ml of IL-6 for 15 min and total pSTAT3 levels were assessed by Flow Cytometry. When indicated, cells were pre-treated for 45 min with 10 μM of the indicated Jak inhibitor (Left, ruxolitinib. Right, filgotinib). (C-D) (Left) Representative TIRF images of CD45RA+CD4+ T-cells forming synapses with SLBs (ICAM1 and a-CD3). Cells were pre-treated or not (untreated) for 45 min with 10 μM of ruxolitinib (Top) or filgotinib (Bottom). When indicated, the inhibitor was washed-out before SLB exposure. Cells were fixed and permeabilized after 20 min of SLB exposure and pSTAT3 expression was analyzed. (Right) Plots show quantification of pSTAT3 MFI. Data is the mean ± SE (n>50); ns, not significant; **p<0.01, Kruskal-Wallis test.
Figure 4.
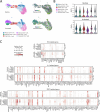
Figure 4.. STAT3-related genes upregulate expression in response to TCR engagement.
(A) (Left) UMAP dimensionality reduction embedding of the activated and resting CD4+ T-cells coloured by orthogonally generated clusters labelled by manual cell type annotation. (Right) A UMAP embedding of scRNAseq dataset of activated and resting CD4+ T-cell population coloured by expression profiles of STAT3. (B) Violin plots of the STAT3 expressions across the different cell types in the activated and resting CD4+ T-cell population. (C) Dot plots depicting mean expression (visualized by colour) and fraction of cells (visualized by the size of the dot) expressing key genes involved in TCR signaling (Top), IL6 signaling (Middle) and STAT3 regulation (Bottom) in resting and activated CD4+ T-cell subtypes.
Figure 5.
Figure 5.. STAT3 activation is less sensitive to Lck inhibition in Rheumatoid Arthritis (RA) patients.
(A-B) Representative TIRF images of CD4+ T-cells from healthy donors (A) or from RA patients (B) exposed to SLBs (ICAM1 and a-CD3) for 20 min. Samples were then fixed, permeabilized and stained for pSTAT3. When indicated, cells were pre-treated for 30 min with Lck inhibitor (10μM). (C) Quantification of pSTAT3 mean fluorescence intensity (MFI) for cells in (A-B). Each dot represents the average MFI of one donor relative to the average MFI of the same donor untreated. Data is the mean +/− SE (n=21 RA patients and n=15 healthy donors); **p<0.01, Mann-Whitney test.

References

    1. Raychaudhuri S., et al. , Genetic variants at CD28, PRDM1 and CD2/CD58 are associated with rheumatoid arthritis risk. Nat Genet, 2009. 41(12): p. 1313–8. - PMC - PubMed
    1. Dustin M.L., The immunological synapse. Arthritis Res, 2002. 4(Suppl 3): p. S119–25. - PMC - PubMed
    1. Rao D.A., et al. , Pathologically expanded peripheral T helper cell subset drives B cells in rheumatoid arthritis. Nature, 2017. 542(7639): p. 110–114. - PMC - PubMed
    1. Webster A.P., et al. , Increased DNA methylation variability in rheumatoid arthritis-discordant monozygotic twins. Genome Med, 2018. 10(1): p. 64. - PMC - PubMed
    1. Wegner N., et al. , Autoimmunity to specific citrullinated proteins gives the first clues to the etiology of rheumatoid arthritis. Immunol Rev, 2010. 233(1): p. 34–54. - PubMed

Publication types