[Preprint]. 2025 Jan 22:2025.01.20.633954.
doi: 10.1101/2025.01.20.633954.

Glycoprotein 130 Antagonism Counteracts Metabolic and Inflammatory Alterations to Enhance Right Ventricle Function in Pulmonary Artery Banded Pigs

Affiliations

Glycoprotein 130 Antagonism Counteracts Metabolic and Inflammatory Alterations to Enhance Right Ventricle Function in Pulmonary Artery Banded Pigs

Jenna B Mendelson et al. bioRxiv. .

Abstract

Background: Right ventricular dysfunction (RVD) is a risk factor for death in multiple cardiovascular diseases, but RV-enhancing therapies are lacking. Inhibition of glycoprotein-130 (GP130) signaling with the small molecule SC144 improves RV function in rodent RVD via anti-inflammatory and metabolic mechanisms. However, SC144's efficacy and molecular effects in a translational large animal model of RVD are unknown.

Methods: 4-week-old castrated male pigs underwent pulmonary artery banding (PAB). After 3 weeks, PAB pigs were randomized into 2 groups (daily injections of SC144 [2.2 mg/kg, PAB-SC144, n=5] or vehicle [PAB-Veh, n=5] for 3 weeks). Five age-matched pigs served as controls. Cardiac MRI quantified RV size/function. Right heart catheterization evaluated hemodynamics. Single-nucleus RNA sequencing delineated cell-type specific changes between experimental groups. Electron microscopy evaluated RV mitochondrial morphology. Phosphoproteomics identified dysregulated RV kinases. Lipidomics and metabolomics quantified lipid species and metabolites in RV tissue. Quantitative proteomics examined RV mitochondrial protein regulation.

Results: SC144 significantly improved RV ejection fraction (Control: 60±4%, PAB-Veh: 22±10%, PAB-SC144: 37±6%) despite similar RV afterload. Single-nucleus RNA sequencing demonstrated PAB-Veh pigs had lower cardiomyocyte and higher macrophage/lymphocyte/pericyte/endothelial cell abundances as compared to control, and many of these changes were blunted by SC144. SC144 combatted the downregulation of cardiomyocyte metabolic genes induced by PAB. Kinome enrichment analysis suggested SC144 counteracted RV mTORC1 activation. Correspondingly, SC144 rebalanced RV autophagy pathway proteins and improved mitochondrial morphology. Integrated lipidomics, metabolomics, and proteomics analyses revealed SC144 restored fatty acid metabolism. Finally, CellChat analysis revealed SC144 restored pericyte-endothelial cell cross-talk.

Conclusion: GP130 antagonism blunts elevated immune cell abundance, reduces pro-inflammatory gene transcription in macrophages and lymphocytes, rebalances autophagy and preserves fatty acid metabolism in cardiomyocytes, and restores endothelial cell and pericyte communication to improve RV function.


Figures

Figure 1:
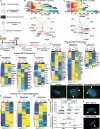
Figure 1:. GP130 antagonism enhanced RV function and mitigated cardiomyocyte hypertrophy.
(A) Representative still images from terminal cMRI studies. (B) Treatment with SC144 significantly enhanced RV function compared to PAB-Veh pigs (control: 60±4%, PAB-Veh: 22±10%, PAB-SC144: 37±6%) (C) Afterload was similar between PAB-Veh and PAB-SC144 pigs (PAB-Veh: 31±10, PAB-SC144: 31±5). (D) Pulmonary artery constriction was comparable in PAB-Veh and PAB-SC144 pigs (PAB-Veh: 89±2%, PAB-SC144: 86±5%). (E) Representative confocal microscopy images of RV sections stained with wheat germ agglutinin (green: WGA, blue: DAPI) to evaluate cardiomyocyte hypertrophy. (F) Treatment with SC144 prevented cardiomyocyte hypertrophy (control: 131±54 μm2, PAB-Veh: 200±70 μm2, PAB-SC144: 129±62 μm2). Kruskal-Wallis ANOVA with Dunn post hoc test in F.
Figure 2:
Figure 2:. snRNAseq identified alterations in the cellular landscape in the three experimental groups.
(A) Steps of single-nucleus RNA sequencing (snRNAseq) analysis. (B) Uniform manifold approximation and projection (UMAP) visualization of 8 cell types identified with unsupervised clustering. (C) Canonical markers used to validate cell type identities. UMAP and relative abundances of each cell type in (D) control, (E) PAB-Veh, and (F) PAB-SC144 RVs. (G) Correlation analysis of relative abundance and ejection fraction (EF). The relative abundances of macrophages, lymphocytes, and pericytes were significantly negatively associated with EF, and cardiomyocyte abundance was significantly positively correlated to EF. (H) Principal component analysis separated experimental groups using nuclei relative abundance. Differential expression analysis of pseudobulked data from all 8 cell types (red: Log2FoldChange>0.5 and adjusted p-value<0.05, blue: Log2FoldChange<−0.5 and adjusted p-value<0.05) comparing (I) PAB-Veh vs control, (J) PAB-SC144 vs control, and (K) PAB-SC144 vs PAB-Veh. The comparison between PAB-Veh and control had the most DEGs, and cardiomyocytes had the most DEGs across comparisons.
Figure 3:
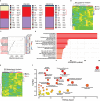
Figure 3:. Cardiomyocyte metabolic genetic programming was altered by PAB but partially rescued with SC144 treatment.
(A) UMAP displaying 8 subgroups of cardiomyocytes (CM). (B) Percent of CM nuclei from each pig across subgroups. (C) UMAP visualizing changes in cardiomyocyte subclusters between experimental groups. (D) Correlation analysis of relative abundance of cardiomyocyte subclusters and ejection fraction (EF). CM3 was negatively correlated to EF and CM2 was positively correlated to EF. Pathway analysis of DEGs (E) increased and (F) decreased in PAB-Veh nuclei compared to control. Pathways of DEGs (G) elevated and (H) decreased in PAB-SC144 compared to control. Metabolic pathways were altered by PAB and treatment with SC144, and downstream GP130 signaling was reduced in PAB-SC144 compared to control. (I) Pathway analysis of DEGs upregulated in PAB-SC144 compared to PAB-Veh. There were no enriched pathways comparing DEGs downregulated in PAB-SC144 and PAB-Veh.
Figure 4:
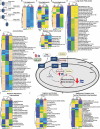
Figure 4:. SC144 counteracted mTORC1-associated autophagic alterations.
(A) Schematic of phosphoproteomics analysis. (B) Two (MAPK, PRKCZ, italicized, red stars) of the top 10 kinases identified in PAB-Veh were downstream of GP130. The mTORC1 subunit, RPS6KB1 (red italics) was also predicted to be enriched. (C) In PAB-SC144 RVs, several polo-like kinases (PLK, red italics), which antagonize mTORC1 were predicted to be enriched. (D) Primary steps in autophagy. Contents are isolated in an autophagosome, which fuses with a lysosome where the products are degraded and recycled. mTORC1 inhibits the initiation of autophagy. The autophagy inhibitor, bafilomycin (BAF), prevents lysosome and autophagosome fusion. Light chain 3 (LC3) is a component of autophagosomes. Porcine RV proteomics of the (E) autophagy, (F) mitophagy, and (G) lysosome pathways revealed many proteins were downregulated in PAB-Veh, but normalized with SC144 treatment. (H) Human PAH patients with decompensated RV function (dRV) had mostly decreased abundances of autophagy pathway proteins. (I) Mitophagy pathway proteins were mostly upregulated in dRV patients. (J) dRV patients had primarily decreased abundances of lysosome pathway proteins. Transcriptionally, similar numbers of genes had reduced expression between dRV, and compensated RV (cRV) patients in the (K) autophagy and (L) mitophagy pathway, but hierarchical cluster analysis clustered cRV and control groups together. (M) Lysosome pathway transcripts were mostly increased in cRV patients compared to dRV and control. (N) Representative confocal micrographs of human induced pluripotent stem cells differentiated into cardiomyocytes (iPSC-CMs) showed treatment with the autophagy inhibitor BAF or the GP130 ligand oncostatin M (OSM) increased LC3 positive puncta (white arrows: representative LC3 puncta; green: LC3; blue: DAPI) quantified as (O) the percent area occupied by LC3 puncta. (P) Representative confocal micrographs of subsequent iPSC-CMs treated with either BAF or OSM with SC144 demonstrated SC144 treatment prevented LC3 accumulation (white arrows, green: LC3, blue: DAPI) quantified as (Q) the percent area occupied by LC3. In E-M Scale bars show relative changes between groups.
Figure 5:
Figure 5:. GP130 inhibition normalized mitochondrial dimensions, cristae morphology and mitigated dysregulation of oxidative phosphorylation and fatty acid metabolism proteins.
(A) Representative electron micrograph demonstrating PAB-Veh mitochondria are smaller and more fragmented (white arrows). GP130 antagonism with SC144 normalized (B) mitochondrial shape assessed by length to width ratio (control: 1.8±0.7, PAB-Veh: 1.6±0.6, PAB-SC144: 1.9±0.9), and (C) mitigated changes in cristae abundance (control: 1.7±1, PAB-Veh: 1.4±1, PAB-SC144: 1.5±1). (D) Hierarchical cluster analysis and (E) partial least squares discriminant analysis of RV mitochondrial enrichment proteomics cluster PAB-SC144 clusters with control (F) Pathway analysis identified 6 of the top 20 pathways are related to metabolism (italicized, red star). (G) Proteins in complexes I-V of the electron transport chain were downregulated in PAB-Veh mitochondria, and normalized with SC144 treatment. (H) Schematic of complexes I-V of the electron transport chain. Red arrows (PAB-Veh) and blue equal signs (PAB-SC144) visualize changes compared to control abundances. (I) Proteins in the mitochondrial beta-oxidation pathway were reduced in PAB-Veh RVs, but not PAB-SC144 RVs. (J) Key proteins in the mitochondrial beta-oxidation pathway which produce cofactors for the electron transport chain and Acetyl-CoA for the TCA cycle. ACAD: acyl-coA dehydrogenase; ECH: enoyl-CoA hydratase; HADHA: hydroxyacyl-CoA dehydrogenase subunit A; HADHB: hydroxyacyl-CoA dehydrogenase subunit; MTP: mitochondrial trifunctional protein. Scale bars show relative changes between groups in D,G,I. Kruskal-Wallis ANOVA with Dunn post hoc test in B,C.
Figure 6:
Figure 6:. Combined lipidomics and metabolomics analyses identified altered RV metabolism.
(A) PAB-Veh and PAB-SC144 had a reduction in the total percentage of triacylglycerols (TAG, control: 21%, PAB-Veh: 1%, PAB-SC144: 3%), and an increase in phosphatidylcholines (PC, control: 32%, PAB-Veh: 41%, PAB-SC144: 40%) and phosphatidylethanolamines (PE, control: 37%, PAB-Veh: 45%, PAB-SC144: 44%). (B) Hierarchical cluster analysis of lipidomics clustered PAB-Veh and PAB-SC144 groups together. (C) Random forest classification identified the top 15 lipids in distinguishing between experimental groups. 9 of 15 are TAG species. (D) Lipid Ontology enrichment analysis revealed triacylglycerols, glycerolipids, and fatty acids were the most enriched pathways. (E) Hierarchical cluster analysis of metabolomics data clustered PAB-Veh and PAB-SC144 groups together. (F) Pathway analysis of metabolomics data identified amino acid metabolism pathways account for many of the most enriched pathways. Scale bars show relative changes between samples in B,E
Figure 7:
Figure 7:. SC144 counteracted changes in lipid and fatty acid metabolism, but did not markedly alter amino acid metabolism.
(A) Central steps in the breakdown of triacylglycerols into diacylglycerols and monoacylglycerols. ATGL: adipose triacylglycerol lipase; HSL: hormone sensitive lipase; MGL: monoacylglycerol lipase (B) Abundances of triacylglycerols are reduced in PAB-Veh and PAB-SC144. (C) Diacylglycerols were similar between all groups. (D) Abundances of monoacylglycerols are elevated in PAB-Veh RVs. (E) Long chain fatty acid species are decreased in PAB-Veh RVs compared to control and PAB-SC144. (F) Abundances of medium chain fatty acids are increased in PAB-Veh pigs. (G) Most acylcarnitines are increased in PAB-Veh RVs compared to control and PAB-SC144 RVs. (H) Key proteins and metabolites of the acylcarnitine shuttle in mitochondria. Red arrows (PAB-Veh) and blue equal signs (PAB-SC144) visualize changes in these metabolites compared to control. A carnitine molecule is exchanged for the CoA of a fatty acyl-CoA, and the subsequent acylcarnitine is transported into the mitochondrial matrix. The carnitine molecule is removed, and the fatty acyl-CoA undergoes beta-oxidation. ACS: acyl-CoA synthetase; CPT1: carnitine palmitoyltransferase I; CACT: carnitine acylcarnitine translocase; CPT2: carnitine palmitoyltransferase II. (I) PAB-Veh and PAB-SC144 RVs had similar abundances of metabolites in the histidine metabolism pathway. (J) Many metabolites in the arginine and proline, and (K) methionine, cysteine, and taurine metabolism pathways were increased in PAB-Veh and PAB-SC144 RVs. Scale bars show relative changes between groups in B-G, I-K
Figure 8:
Figure 8:
Proposed mechanism demonstrating GP130 antagonism with SC144 improves RV function. SC144 reduces the abundance of macrophages and lymphocytes and blocks pro-inflammatory gene transcription in both cell types, rebalances autophagy and preserves fatty acid metabolism, and restores endothelial cell and pericyte communication.

Similar articles

References

    1. Ghio S, Gavazzi A, Campana C, Inserra C, Klersy C, Sebastiani R, Arbustini E, Recusani F, Tavazzi L. Independent and additive prognostic value of right ventricular systolic function and pulmonary artery pressure in patients with chronic heart failure. J Am Coll Cardiol. 2001;37(1):183–8. doi: 10.1016/s0735-1097(00)01102-5. - DOI - PubMed
    1. Vonk Noordegraaf A, Westerhof BE, Westerhof N. The Relationship Between the Right Ventricle and its Load in Pulmonary Hypertension. J Am Coll Cardiol. 2017;69(2):236–43. doi: 10.1016/j.jacc.2016.10.047. - DOI - PubMed
    1. Voelkel NF, Gomez-Arroyo J, Abbate A, Bogaard HJ, Nicolls MR. Pathobiology of pulmonary arterial hypertension and right ventricular failure. Eur Respir J. 2012;40(6):1555–65. Epub 20120627. doi: 10.1183/09031936.00046612. - DOI - PMC - PubMed
    1. Friedberg MK, Reddy S. Right ventricular failure in congenital heart disease. Curr Opin Pediatr. 2019;31(5):604–10. doi: 10.1097/MOP.0000000000000804. - DOI - PMC - PubMed
    1. Cho YK, Ma JS. Right ventricular failure in congenital heart disease. Korean J Pediatr. 2013;56(3):101–6. Epub 20130318. doi: 10.3345/kjp.2013.56.3.101. - DOI - PMC - PubMed

Publication types

LinkOut - more resources