[Preprint]. 2025 Jan 23:2025.01.22.634403.
doi: 10.1101/2025.01.22.634403.

Construction of Multi-Modal Transcriptome-Small Molecule Interaction Networks from High-Throughput Measurements to Study Human Complex Traits

Affiliations

Construction of Multi-Modal Transcriptome-Small Molecule Interaction Networks from High-Throughput Measurements to Study Human Complex Traits

Vaha Akbary Moghaddam et al. bioRxiv. .

Abstract

Small molecules (SMs) are integral to biological processes, influencing metabolism, homeostasis, and regulatory networks. Despite their importance, a significant knowledge gap exists regarding their downstream effects on biological pathways and gene expression, largely due to differences in scale, variability, and noise between untargeted metabolomics and sequencing-based technologies. To address these challenges, we developed a multi-omics framework comprising a machine learning-based protocol for data processing, a semi-supervised network inference approach, and network-guided analysis of complex traits. The ML protocol harmonized metabolomic, lipidomic, and transcriptomic data through batch correction, principal component analysis, and regression-based adjustments, enabling unbiased and effective integration. Building on this, we proposed a semi-supervised method to construct transcriptome-SM interaction networks (TSI-Nets) by selectively integrating SM profiles into gene-level networks using a meta-analytic approach that accounts for scale differences and missing data across omics layers. Benchmarking against three conventional unsupervised methods demonstrated the superiority of our approach in generating diverse, biologically relevant, and robust networks. While single-omics analyses identified 18 significant genes and 3 significant SMs associated with insulin sensitivity (IS), network-guided analysis revealed novel connections between these markers. The top-ranked module highlighted a cross-talk between fiber-degrading gut microbiota and immune regulatory pathways, inferred by the interaction of the protective SM, N-acetylglycine (NAG), with immune genes (FCER1A, HDC, MS4A2, and CPA3), linked to improved IS and reduced obesity and inflammation. Together, this framework offers a robust and scalable solution for multi-modal network inference and analysis, advancing SM pathway discovery and their implications for human health. Leveraging data from a population of thousands of individuals with extended longevity, the inferred TSI-Nets demonstrate generalizability across diverse conditions and complex traits. These networks are publicly available as a resource for the research community.


Conflict of interest statement

Declaration of Competing interest G.J.P. is a scientific advisory board member for Cambridge Isotope Laboratories and has a collaborative research agreement with Agilent Technologies. G.J.P. is the Chief Scientific Officer of Panome Bio.

Figures

Figure 1.
Figure 1.. General workflow of the study.
a) In the first section of the study, a ML-based protocol is proposed, composed of data transformation and regression-based adjustments to prepare the LC/MS and RNA-seq profiles for integration. b) In the second part, conventional unsupervised network inference approaches as well as a newly proposed semi-supervised method were used to construct TSI-Nets. The semi-supervised method includes unsupervised construction of gene-level networks from the RNA-seq profiles with the conventional approaches, followed by supervise integration of SMs into the baseline networks. c) The semi-supervised method is benchmarked against the conventional approaches using multiple evaluation metrics. d) Upon benchmarking the resulting TSI-Nets, they were used to study metabolic traits, such as IS or BMI, in a network-guided manner.
Figure 2.
Figure 2.. LC/MS data processing results.
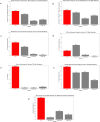
a) From left to right, the first plot illustrates the distribution of raw peak areas for dimethtylguanidino valeric acid (DMGV). Second plot demonstrates the distribution of DMGV upon adjustments for technical, demographical, and biological covariates. Third plot shows the distribution of FCER1A gene upon data processing. Finally, the fourth plot represents the distribution of insulin sensitivity upon covariate adjustment. b) The plot on the left illustrates the heritibality (h2) of lipids across different lipid categories. The plot on the right illustrates the h2 of polar SMs grouped by their primary source. c) QQ-plot of FCER1A gene with raw metabolome peak areas (left) and processed peak areas (right). Lipid categories include: “Acar”: acetylcarnitines, “Cer”: ceramides, “CE”: cholesterol esters, “DG”: diglycerides, “HexCer”: hexosylceramides, “LPC”: lysophosphatidylcholines, “LPE”: lysophosphatidylethanolamines, “PC”: phosphatidylcholines, “PE”: phosphatidylethanolamines, “SM”: sphingomyelins. The primary source of polars include: “Diet”: from dietary sources, “Diet / Gut microbiome”: from gut microbiome metabolism, “Mixed”: from dietary and endogenous sources, “Endogenous”: synthesized internally within the body, “Drugs”, “Exposures – Others”, and “Limited source information”.
Figure 3.
Figure 3.. Benchmarking network inference approaches for TSI-Net construction.
a) Represents the proportion of TSI-Net modules with significant hits from MSEA. b) Represents the average proportion of gene-gene interactions supported by STRINGdb PPI networks. For each module, proportion of support was calculated, which was averaged across all modules. c) Represents the average proportion of genes co-regulated by same TFs based on the blood-specific GRNs. d) Represents the proportion of TSI-Net modules with significant GO terms. e) Representation of genes profiled in the LLFS across TSI-Nets inferred by each method. f) Representation of SMs profiled in the LLFS across TSI-Nets inferred by each method. g) Total number of TSI-Net modules inferred by each method.
Figure 4.
Figure 4.. CMA-derived TSI-Net properties.
a) Violin plots representing the composition of the TSI-Net modules based on the proportion of SMs across modules in the LLFS and knowledge-guided TSI-Nets. b) Violin plots of the variance explained by PC1 across the LLFS TSI-Net modules. For each module, separate PCA were performed on genes and SMs participating in the module. c) Histogram of the average −log10(p-value) of SM-SM associations in the TSI-Net modules. In each module, pairwise SM-SM associations were assessed and subsequently averaged for the number of pairs. The maximum range of the plot was set to −log10(p-value) ≤ 30 for readability. d) Average percentage of support for SM-molecule interacting genes across the LLFS TSI-Nets based on the STRINGdb PPI and blood GRN. Percentage of support for the gene set of each SM was calculated and averaged across all SMs.
Figure 5.
Figure 5.. Demonstration of the significant gene-SM interactions in the top-ranked module for IS.
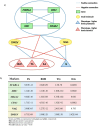
a) NAG and DMGV are connected to all 4 genes illustrated in the sub-module. NAG is also connected to BMI and TG (not IL6), DMGV is connected to BMI, TG, and IL6, and the 4 genes are connected to BMI and TG. However, only FCER1A, HDC, and CPA3 are connected to IL6. The large blue and red ellipses are used for clear illustration. b) Association summary of the significant nodes of the top-ranked module for the metabolic traits.

References

    1. Clish C. B., “Metabolomics: an emerging but powerful tool for precision medicine,” Cold Spring Harbor Molecular Case Studies, vol. 1, no. 1, pp. a000588, 2015, doi: 10.1101/mcs.a000588. - DOI - PMC - PubMed
    1. Wishart D. S. et al. “HMDB: the Human Metabolome Database,” Nucleic Acids Research, vol. 35, no. Database issue, pp. D521–D526, 2007, doi: 10.1093/nar/gkl923. - DOI - PMC - PubMed
    1. Qiu S. et al. “Small molecule metabolites: discovery of biomarkers and therapeutic targets,” Signal Transduction and Targeted Therapy, vol. 8, no. 132, pp. 1–11, 2023, doi: 10.1038/s41392-023-01399-3. - DOI - PMC - PubMed
    1. Wang J. H., Byun J., and Pennathur S., “Analytical approaches to metabolomics and applications to systems biology,” Seminars in Nephrology, vol. 30, no. 5, pp. 500–511, 2010, doi: 10.1016/j.semnephrol.2010.07.007. - DOI - PMC - PubMed
    1. Dréno B. et al. “The influence of exposome on acne,” Journal of the European Academy of Dermatology and Venereology, vol. 32, no. 5, pp. 812–819, 2018, doi: 10.1111/jdv.14820. - DOI - PMC - PubMed

Publication types

LinkOut - more resources