[Preprint]. 2025 Jan 23:2025.01.21.633969.
doi: 10.1101/2025.01.21.633969.

Benchmarking and optimizing Perturb-seq in differentiating human pluripotent stem cells

Affiliations

Benchmarking and optimizing Perturb-seq in differentiating human pluripotent stem cells

Sushama Sivakumar et al. bioRxiv. .

Abstract

Perturb-seq is a powerful approach to systematically assess how genes and enhancers impact the molecular and cellular pathways of development and disease. However, technical challenges have limited its application in stem cell-based systems. Here, we benchmarked Perturb-seq across multiple CRISPRi modalities, on diverse genomic targets, in multiple human pluripotent stem cells, during directed differentiation to multiple lineages, and across multiple sgRNA delivery systems. To ensure cost-effective production of large-scale Perturb-seq datasets as part of the Impact of Genomic Variants on Function (IGVF) consortium, our optimized protocol dynamically assesses experiment quality across the weeks-long procedure. Our analysis of 1,996,260 sequenced cells across benchmarking datasets reveals shared regulatory networks linking disease-associated enhancers and genes with downstream targets during cardiomyocyte differentiation. This study establishes open tools and resources for interrogating genome function during stem cell differentiation.


Figures
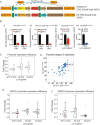
Figure 1:
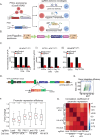
Figure 1:. Engineering PSCs for diverse Perturb-seq applications:
A) Schematic of transgene integrated in the CLYBL GSH locus in constitutive H9/WTC11 dCK and inducible H9 idCK PSCs. EF1-mcherry selection cassette is placed upstream of dCas9- KRAB to allow selection of cells during ESC line construction. B) qPCR showing repression of indicated targets using lentiviral sgRNAs in (i) H9 dCK, (ii) WTC11 dCK- YS, (iii & iv) H9 idCK C). Graph showing median repression efficiency of all promoters in indicated PSCs infected with lentiviral sgRNAs. D) Correlation map of promoter repression efficiency across H9 dCK and WTC11 dCK. Red target indicates repression of NKX2–5. E) Graph showing median repression efficiency of NKX2–5 promoter in indicated cell lines. Each dot represents a single sgRNA targeting NKX2–5 promoter. F) Graph showing median repression efficiency of CSRP3 enhancer in indicated cell lines. Each dot represents a single sgRNA.
Figure 2:
Figure 2:. Comparing sgRNA delivery methods to optimize target gene repression:
A) Schematic of lentiviral (LV) or Piggybac (PB)-transposon or recombinase PA01 mediated sgRNA delivery into dCK PSCs (WTC11/ H9). B) schematic of U6-sgRNA construct that is nucleofected (PB) or used to infect (LV) cells. Placing the U6-sgRNA cistron upstream of the EF1-mTagBFP-puromycin selection cassette allows for optimum expression of U6-sgRNA, efficient capture of sgRNAs during sc-RNAseq and good target repression. C) qPCR showing repression of Bex3 target in i) H9 dCK, ii) WTC11 dCK and iii) H9 idCK PSCs or differentiated CMs nucleofected with PB Bex3 sgRNA or non-targeting sgRNA. D) Schematic of recombinase PA01 landing pad inserted into AAVS1 locus in WTC11 dCK and the sgRNA donor plasmid used. E) FACS plot showing donor integration efficiency within landing pad at AAVS1 locus in WTC11 dCK PA01 PSCs. F) Graph showing repression efficiency of all promoter sgRNAs in Perturb-seq experiment in different cell lines and with different sgRNA delivery mechanisms. G) Heatmap showing correlation coefficient of promoter repression across cell lines and sgRNA delivery mechanisms. There is high correlation in promoter repression across all comparisons.
Figure 3:
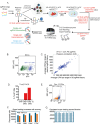
Figure 3:. Perturb-seq workflow and key QC steps:
A) Schematic of steps during Perturb-seq workflow including QC steps to ensure optimum sgRNA library coverage and efficient CM differentiation. B) FACS plot showing BFP positive PSCs selected after sgRNA integration. C) sgRNA sequencing of plasmid library correlates highly with sgRNA coverage in PSCs after integration. D) graph showing percentage of Tnnt2+ cells by FACS on day 8 and day 12 of CM differentiation. E) FACS plot showing BFP+ CMs were sorted and used for library preparation during scRNA-seq. F) Graph showing ~60K cells were recovered after super loading during scRNA-seq. G) Graph showing consistent recovery of cells after super loading when preparing multiple libraries.
Figure 4:
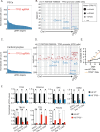
Figure 4:. Clonal expansion during Perturb-seq:
A) Bar plot showing number of cells with single sgRNA in PSC population. B) Manhattan plot showing up and downregulated genes upon repression of p53 in PSCs. C) Bar plot showing number of cells with single sgRNA in CM population. D) Manhattan plot depicting up and downregulated genes in CMs upon repression of p53.E) Growth curve of WT and TP53−/− CMs. F) validation of scRNA-seq results in WT and TP53−/− CMs by qPCR.
Figure 5:
Figure 5:. Constructing regulatory networks from Perturb-seq data:
A) Correlation map showing groupings of perturbations in WTC11 dCK nucleofected with PB-sgRNA library. Groups are based on similarity between differentially regulated transcriptomes. Red squares indicate more similarity, and blue squares indicate poor correlation. B) Venn diagram showing number of biological pathways that overlap between perturbed CMs. C) Correlation map of differentially expressed transcriptomes in H9 dCK nucleofected with PB-sgRNA library. Red squares indicate high similarity between transcriptomes of indicated perturbation and blue squares indicate poor correlation. D) Venn diagram indicating biological pathways that overlap after each indicated perturbation. E) Perturbation of TBX5, TBX20 or NKX2–5 suppresses expression of IRX4 as indicated by scRNA-seq data. F) Validation by qpcr of IRX4 expression in CMs repressed for the indicated cardiac genes by CRISPRi sgRNAs.
Figure 6:
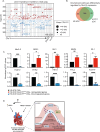
Figure 6:. Identification of a novel NKX2–5 regulatory network in CMs.
A) Manhattan plot showing differentially expressed genes upon NKX2–5 perturbation in H9 dCK CMs. B) Venn diagram showing high overlap in gene programs when NKX2–5 is repressed in H9 dCK and WTC11 dCk perturbed CMs. C) qPCR to validate scRNA-seq data in H9 dCK CMs repressed for NKX2–5 expression. D) Hypothesis on local regulatory loop between NKX2–5 and NRG1. From published literature NRG1 in endocardium regulates proper trabeculae formation in the myocardium. We have unraveled a novel loop in CMs where NKX2–5 repression upregulates NRG1 expression.

References

    1. Replogle J. M. et al. Mapping information-rich genotype-phenotype landscapes with genome-scale Perturb-seq. Cell 185, 2559–2575.e28 (2022). - PMC - PubMed
    1. Adamson B. et al. A Multiplexed Single-Cell CRISPR Screening Platform Enables Systematic Dissection of the Unfolded Protein Response. Cell 167, 1867–1882.e21 (2016). - PMC - PubMed
    1. Tian R. et al. Genome-wide CRISPRi/a screens in human neurons link lysosomal failure to ferroptosis. Nat. Neurosci. 24, 1020–1034 (2021). - PMC - PubMed
    1. Dixit A. et al. Perturb-Seq: Dissecting Molecular Circuits with Scalable Single-Cell RNA Profiling of Pooled Genetic Screens. Cell 167, 1853–1866.e17 (2016). - PMC - PubMed
    1. Jaitin D. A. et al. Dissecting immune circuits by linking CRISPR-pooled screens with single-cell RNA-seq. Cell 167, 1883–1896.e15 (2016). - PubMed

Publication types

LinkOut - more resources