[Preprint]. 2025 Jan 22:2025.01.17.633590.
doi: 10.1101/2025.01.17.633590.

Single-cell decoding of human islet cell type-specific alterations in type 2 diabetes reveals converging genetic- and state-driven β -cell gene expression defects

Affiliations

Single-cell decoding of human islet cell type-specific alterations in type 2 diabetes reveals converging genetic- and state-driven β -cell gene expression defects

Khushdeep Bandesh et al. bioRxiv. .

Abstract

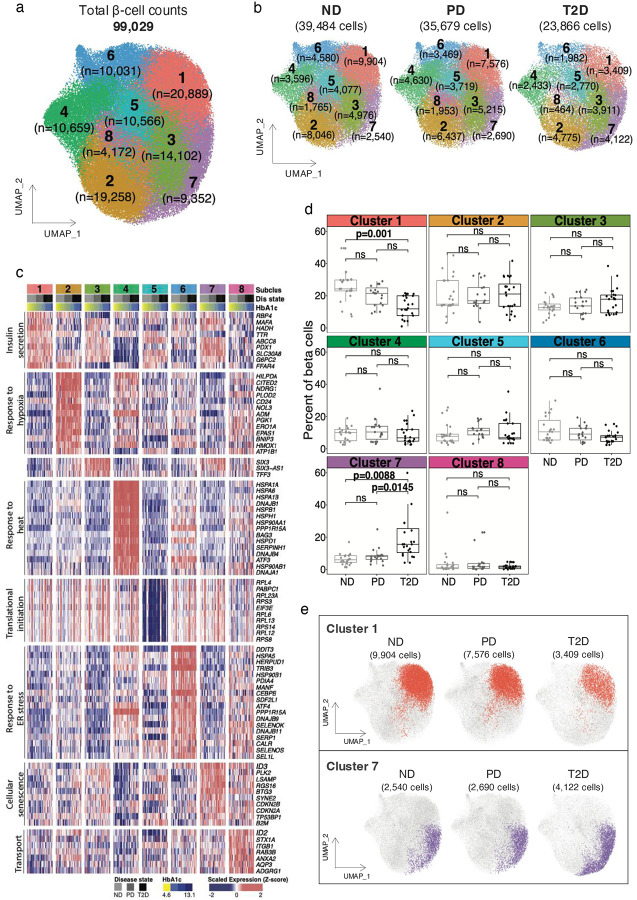
Pancreatic islets maintain glucose homeostasis through coordinated action of their constituent endocrine and affiliate cell types and are central to type 2 diabetes (T2D) genetics and pathophysiology. Our understanding of robust human islet cell type-specific alterations in T2D remains limited. Here, we report comprehensive single cell transcriptome profiling of 245,878 human islet cells from a 48-donor cohort spanning non-diabetic (ND), pre-diabetic (PD), and T2D states, identifying 14 distinct cell types detected in every donor from each glycemic state. Cohort analysis reveals ~25-30% loss of functional beta cell mass in T2D vs. ND or PD donors resulting from (1) reduced total beta cell numbers/proportions and (2) reciprocal loss of 'high function' and gain of senescent β -cell subpopulations. We identify in T2D β -cells 511 differentially expressed genes (DEGs), including new (66.5%) and validated genes (e.g., FXYD2, SLC2A2, SYT1), and significant neuronal transmission and vitamin A metabolism pathway alterations. Importantly, we demonstrate newly identified DEG roles in human β -cell viability and/or insulin secretion and link 47 DEGs to diabetes-relevant phenotypes in knockout mice, implicating them as potential causal islet dysfunction genes. Additionally, we nominate as candidate T2D causal genes and therapeutic targets 27 DEGs for which T2D genetic risk variants (GWAS SNPs) and pathophysiology (T2D vs. ND) exert concordant expression effects. We provide this freely accessible atlas for data exploration, analysis, and hypothesis testing. Together, this study provides new genomic resources for and insights into T2D pathophysiology and human islet dysfunction.


Conflict of interest statement

Conflict of interests The authors declare no competing interests.

Figures

Figure 1:
Figure 1:. Human pancreatic islet single-cell transcriptomes from 48-donor cohort reveal cell type proportion variability in T2D donors.
(a) Human pancreatic islets from 48 cadaveric donors -- 17 with diagnosed type 2 diabetes (T2D), 14 with HbA1c-based prediabetes (PD; HbA1c 5.7%−6.4%), and 17 without diabetes (ND) -- were dissociated into single cells and profiled using droplet-based scRNA-seq to obtain 245,878 high quality islet single cell transcriptomes. (b) Comparison of age, body mass index (BMI, a measure of obesity), and glycated hemoglobin (HbA1c) between T2D, PD, and ND individuals in the cohort. Each dot represents an individual donor. The black line and error bars represent the mean ± standard error of the mean. Significant differences (p<0.05, Games-Howell post-hoc test) are reported. (c) Uniform Manifold Approximation and Projection (UMAP) plots displaying unsupervised clustering of 245,878 cells in ND (left), PD (middle), and T2D (right) donors reveals 14 distinct cell types based on the expression of the 2000 most variable genes across the cells. n=number of single cell transcriptomes obtained for each cell type. (d) Relative percentages of various endocrine cell types, shown in per-donor stacked bar plots across the glycemic states, indicate remarkably fewer β-cells in islets from T2D (bottom) vs. PD (middle) or ND (top) donors. (e) Relative abundance of α-, β-, δ-, and γ-cells in ND, PD, or T2D donors. Dots represent percentage of endocrine cells detected for each donor. Epsilon (ε) cells were rare (0.09%) in all donors and omitted from comparison. The black line and error bars represent the mean ± standard error of the mean. P-values were calculated using Tukey’s honest significance test. Significant differences (p<0.05) are indicated. (f, g) Spearman correlations between HbA1c levels (y-axis) and relative β-cell (f, x-axis) or α-cell (g, x-axis) abundance for all cohort donors (n=48). Bands enclosing the linear regression line represent 99% confidence intervals. Dots represent individual donors colored as in panel (a) based on their glycemic status.
Figure 2:
Figure 2:. Differentially expressed genes in T2D vs. ND β-cells.
(a) Volcano plot of differentially expressed genes in T2D vs. ND β-cells. Each dot denotes a gene. 511 genes with significant differences in expression at false discovery rate (FDR) < 5% and fold change ≥ 50% are colored blue (T2D-downregulated) or purple (T2D-upregulated); gray dots denote those with comparable expression in T2D and ND β-cells. (b,c) Gene set enrichment analysis (GSEA) for differentially expressed genes using the molecular signatures database (MSigDB, BROAD Institute). Enriched non-redundant processes with FDR q<0.05 are shown for upregulated (b) and downregulated (c) gene sets. Number of genes in each functional term is provided as a gene ratio relative to total number of tested upregulated (n=316) or downregulated (n=195) T2D β-cell genes. (d) KEGG- and Wiki- pathways enriched in up- vs. downregulated genes. (e) Heatmap of scaled expression of genes comprising primary enriched molecular pathways identified (d) in T2D vs. ND donors. (f) Volcano plots showing differentially expressed cell death genes in β- (left) or α- (right) cells from T2D vs. ND donor islets. (g) Basal (gray; 0mM glucose) or glucose-stimulated (red; 20 mM glucose) insulin secretion in human EndoC-βH3 cells following shRNA-mediated knockdown of selected target genes or a non-targeting control sequence (NT). Data represent mean ± standard error of the means (s.e.m.) from 5 independent experiments, each represented by dots. Significance was calculated relative to corresponding conditions for NT control cells using unpaired Student’s t-test where *p < 0.05 and **p < 0.01. (h) Stimulation Index (SI) for shRNA gene knockdowns, calculated from high vs. low glucose insulin secretion measured in panel (g). (i) EndoC-βH3 cell viability (assessed via Annexin V and 7-AAD staining) showing relative percentages of viable, early- or late-apoptotic, or necrotic cells after shRNA knockdown of selected genes or NT control. Data represent mean ± s.e.m. from 5 independent flow cytometry experiments, each represented by dots. Significance was assessed relative to corresponding measures in NT cells; *p < 0.05 and **p < 0.01; Student’s t-test.
Figure 3:
Figure 3:. Integrated multimodal analyses prioritize T2D β-cell differentially expressed genes as candidate causal/driver genes.
(a) Comparison of islet eQTL effect sizes from TIGER consortium (y-axis) vs. fold-change in gene expression for T2D β-cell differentially expressed genes (DEGs, x-axis) from this study. Red denotes genes with consistent T2D genetic and disease state effects on expression. Upper right quadrant genes are concordantly upregulated; lower left quadrant genes are concordantly downregulated. Gray denotes genes with opposite islet eQTL vs. T2D β-cell differential expression effects. Blue denotes genes with multiple T2D genetic association signals exhibiting concordant and discordant islet eQTL effects. (b) Comparison of T2D differentially abundant proteins in Humanislets database (y-axis) and T2D β-cell DEGs (x-axis). Red and gray denote genes with concordant or discordant β-cell RNA and islet protein level differences in T2D vs. ND individuals, respectively. (c) T2D β-cell DEGs significantly associated with various glycemic phenotypes in whole-body knockout (KO) mice from the IMPC consortium data. log2 fold change (FC) gene expression in T2D vs. ND β-cells (x-axis) compared to log2 fold change in trait measure in KO mice vs. wild-type mice (y-axis). Circles or diamonds distinguish glucose tolerance (area under glucose response curve and initial response to glucose challenge) vs. fasting glucose phenotypes, respectively. Red denotes genes with KO glycemic phenotypes consistent with T2D physiology while gray genes indicate a T2D-misaligned defect. (d) IMPC glucose homeostasis phenotypes of known diabetes gene (Abcc8 and Kcnj11) and T2D β-cell DEG KO mice compared to wildtype controls. Glucose tolerance measured by initial response to glucose challenge and/or area under the glucose response curve from an intraperitoneal glucose tolerance test (IPGTT). See Supplementary Table 14 for individual measures.
Figure 4:
Figure 4:. β-cell subpopulation differences in T2D vs. ND and PD islets.
(a) Sub-clustering analysis of 99,029 β-cell transcriptomes reveals eight putative subpopulations. n=number of cells in each sub-population. (b) Dot-and-box plots showing β-cell sub-population distributions in ND, PD, and T2D samples. (c) Heatmap of scaled marker gene expression (rows; y-axis) for each β-subcluster (x-axis) aggregated by donors (columns). For each subpopulation, donor profiles are grouped into ND (light gray), PD (dark gray), and T2D (black) states, and then sorted based on ascending HbA1c levels. Enriched biological processes (left) associated with representative differentially expressed genes (right) are shown for each subpopulation. (d) Dot-and-box plots comparing per-donor percentages of each β-cell subpopulation in ND, PD, or T2D individuals. Each dot represents a donor. Bonferroni-adjusted p values from Tukey’s honestly significant difference test are reported for significant differences; ns=not significant. (e) UMAP plots illustrating inversely correlated changes in cluster 1 (decreasing) and cluster 7 (increasing) cells within the bulk β-cell cluster from ND to PD to T2D states.

References

    1. Thurner M. et al. Integration of human pancreatic islet genomic data refines regulatory mechanisms at Type 2 Diabetes susceptibility loci. eLife 7, e31977 (2018). - PMC - PubMed
    1. Stitzel M. L. et al. Global Epigenomic Analysis of Primary Human Pancreatic Islets Provides Insights into Type 2 Diabetes Susceptibility Loci. Cell Metabolism 12, 443–455 (2010). - PMC - PubMed
    1. Varshney A. et al. Genetic regulatory signatures underlying islet gene expression and type 2 diabetes. Proceedings of the National Academy of Sciences 114, 2301–2306 (2017). - PMC - PubMed
    1. Cabrera O. et al. The unique cytoarchitecture of human pancreatic islets has implications for islet cell function. Proceedings of the National Academy of Sciences 103, 2334–2339 (2006). - PMC - PubMed
    1. Noguchi G. M. & Huising M. O. Integrating the inputs that shape pancreatic islet hormone release. Nat Metab 1, 1189–1201 (2019). - PMC - PubMed

Publication types

LinkOut - more resources