. 2025 Jan 17:15:1469885.
doi: 10.3389/fimmu.2024.1469885. eCollection 2024.

Enhancement of host defense against Helicobacter pylori infection through modulation of the gastrointestinal microenvironment by Lactiplantibacillus plantarum Lp05

Affiliations

Enhancement of host defense against Helicobacter pylori infection through modulation of the gastrointestinal microenvironment by Lactiplantibacillus plantarum Lp05

Yao Dong et al. Front Immunol. .

Abstract

Objective: This study aimed to assess the impact of Lactiplantibacillus plantarum Lp05 (Lp05) on the gastrointestinal microbiome and pathophysiological status of mice infected with Helicobacter pylori (H. pylori), exploring its potential as a probiotic treatment for H. pylori infections.

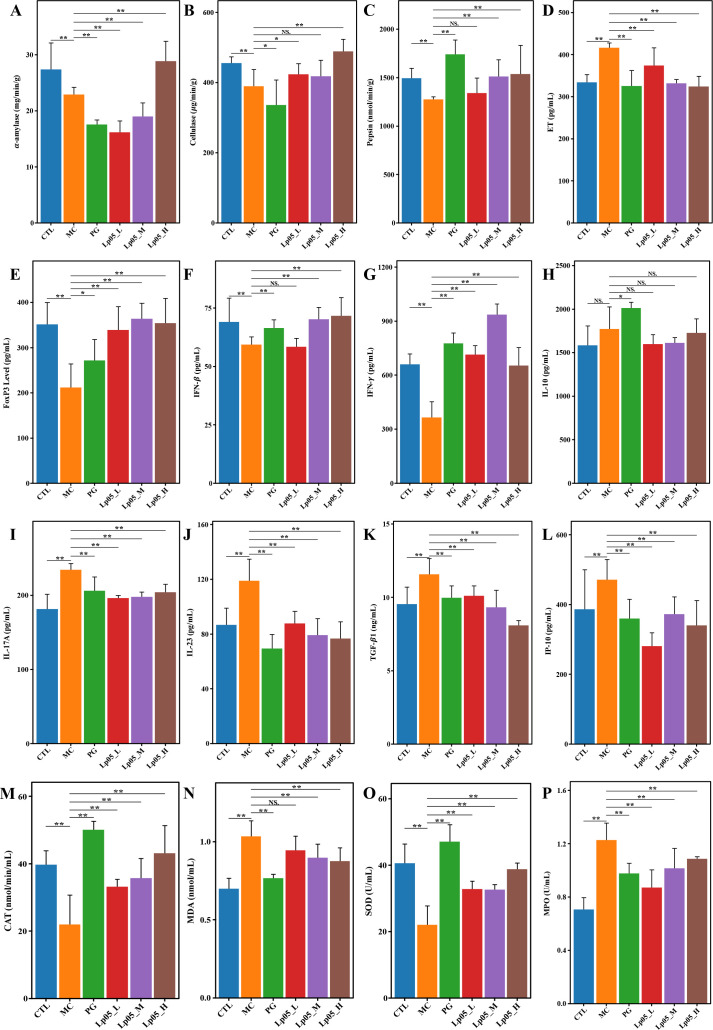
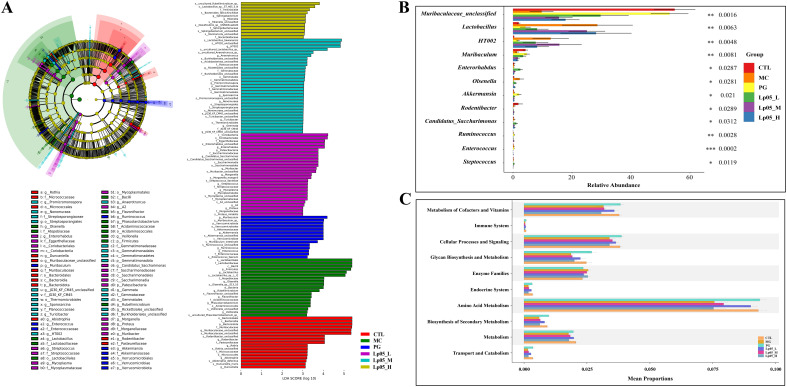
Methods: In vitro, the interaction between Lp05 and H. pylori was analyzed using laser confocal and scanning electron microscopy. In vivo, C57BL/6 mice infected with H. pylori were treated with Lp05 and divided into six groups: control, model, quadruple therapy, and three dosage levels of Lp05 (2×10⁷, 2×10⁸, 2×10⁹ CFU/mouse/day). Over six weeks, the impact of Lp05 on the gastrointestinal microbiome and physiological markers was assessed. Measurements included digestive enzymes (α-amylase, pepsin, cellulase), inflammatory markers (interleukin-17A, interleukin-23, interleukin-10, interferon-β, interferon-γ, FoxP3, endothelin, IP-10, TGF-β1), oxidative stress markers (catalase, malondialdehyde, superoxide dismutase, myeloperoxidase), and tissue pathology (via modified Warthin-Starry silver and H&E staining). Microbial community structure in the stomach and intestines was evaluated through 16S rRNA gene sequencing.

Results: In vitro studies showed Lp05 and H. pylori formed co-aggregates, with Lp05 potentially disrupting H. pylori cell structure, reducing its stomach colonization. In vivo, Lp05 significantly lowered gastric mucosal urease activity and serum H. pylori-IgG antibody levels in infected mice (p < 0.01). It also mitigated pathological changes in the stomach and duodenum, decreased inflammatory responses (ET, IL-17A, IL-23, TGF-beta1, and IP-10, p < 0.01 for all), and enhanced antioxidant enzyme activities (CAT and SOD, p < 0.01) while reducing MDA and MPO levels (p < 0.01), combating oxidative stress from H. pylori infection. Lp05 treatment significantly modified the intestinal and gastric microbiota, increasing beneficial bacteria like Lactobacillus and Ligilactobacillus, and decreasing harmful bacteria such as Olsenella, linked to pathological conditions.

Conclusion: Lp05 effectively modulates the gastrointestinal microbiome, reduces inflammation and oxidative stress, and suppresses H. pylori, promising for probiotic therapies with further research needed to refine its clinical use.

Keywords: Helicobacter pylori; Lactiplantibacillus plantarum; gastric microenvironment; gut microbiota; inflammatory markers.


Conflict of interest statement

Authors YD, YQ and ZG were employed by Wecare Probiotics Co., Ltd. The remaining authors declare that the research was conducted in the absence of any commercial or financial relationships that could be construed as a potential conflict of interest.

Figures

Figure 1
Figure 1
Experimental design diagram of the Helicobacter pylori SS1 infection model in mice.
Figure 2
Figure 2
In vitro assessment of Lactiplantibacillus plantarum Lp05 inhibitory effect on Helicobacter pylori SS1. (A) Confocal laser scanning microscopy images after 2 h of co-aggregation between Lp05 and H pylori SS1; (a–c): H pylori SS1 cultured alone; (d–f) Lp05 and H pylori SS1 co-cultured; (a, d) - bright field; (b, e) - dark field; (c, f) - overlay. (B) Scanning electron microscopy images of co-aggregates between Lp05 and H pylori SS1; (a) shows H pylori SS1; (b) shows Lp05; (c, d) show the co-aggregates (c) x5000, (d) x10000.
Figure 3
Figure 3
Effects of Lactiplantibacillus plantarum Lp05 on mice infected with H pylori. (A) Impact on gastric mucosal urease activity. (B) Levels of anti-H. pylori IgG antibodies in mouse serum. (C) Gastric tissue sections stained with Warthin-Starry silver staining; subpanels a-f correspond to CTL (control), MC (H. pylori infection model), PG (quadruple therapy group), Lp05_L (low dose, 2×10⁷ CFU), Lp05_M (medium dose, 2×10⁸ CFU), Lp05_H (high dose, 2×10⁹ CFU), respectively. *: p < 0.05, **: p < 0.01, ****: p < 0.0001.
Figure 4
Figure 4
H&E staining of gastric and duodenal tissues in mice infected with H. pylori across Lactiplantibacillus plantarum Lp05 dosages. (A–L) Pathological images of gastric tissue HE stains; (M–R) Pathological images of duodenal tissue HE stains. Groups, CTL (control), MC (H. pylori infection model), PG (quadruple therapy group), Lp05_L (low-dose, 2×10⁷ CFU), Lp05_M (medium-dose, 2×10⁸ CFU), Lp05_H (high-dose, 2×10⁹ CFU).
Figure 5
Figure 5
Effects of Lactiplantibacillus plantarum Lp05 on pepsin activity, immune response, and oxidative stress levels in mice infected with Helicobacter pylori. (A–C) Activities of gastric proteases: α-amylase, cellulase, and pepsin; (D–L) Levels of ET, FoxP3, IFN-β, IFN-γ, IL-10, IL-17A, IL-23, TGF- β1, IP-10; (M–P) Levels of CAT, MDA, SOD, and MPO. ** indicates p < 0.01, * indicates p < 0.05. NS indicates p > 0.05.
Figure 6
Figure 6
Impact of Lactiplantibacillus plantarum Lp05 doses on gastric microbial composition and structure. (A) Venn diagram analysis of the gastric microbiome sequencing; (B–E) Alpha diversity analysis of the gastric microbiome; (F) Beta diversity analysis of the gastric microbiome through PCoA; (G, H) Relative abundance of species at the phylum and genus levels in the gastric microbiome; CTL, control group; MC, H pylori infection model group; Lp05_L, low-dose group (2×10⁷ CFU); Lp05_M, medium-dose group (2×10⁸ CFU); Lp05_H, high-dose group (2×10⁹ CFU). NS indicates p > 0.05,* indicates p < 0.05.
Figure 7
Figure 7
Effects of Lactiplantibacillus plantarum Lp05 doses on gastric microbial species abundance. (A) Phylogenetic cladogram and LefSe analysis LDA score histograms generated from metagenomic data; circle size is proportional to the abundance of taxonomic units. (B) STAMP analysis of differences at the genus level in the gastric microbiome. (C) PICRUSt analysis predicts the functions of gastric microbiome taxa at KEGG level 2.
Figure 8
Figure 8
Impact of Lactiplantibacillus plantarum Lp05 doses on cecal microbial composition and structure. (A) Venn diagram analysis of intestinal microbiota sequencing; (B–E) Alpha diversity metrics of the intestinal microbiota; (F) Beta diversity of the intestinal microbiota assessed via PCoA analysis; (G, H) Relative abundance of species at the phylum and genus levels within the intestinal microbiota. Groups, CTL (control), MC (H. pylori infection model), Lp05_L (low dose, 2×10⁷ CFU), Lp05_M (medium dose, 2×10⁸ CFU), Lp05_H (high dose, 2×10⁹ CFU). NS indicates p > 0.05,* indicates p < 0.05.
Figure 9
Figure 9
Effects of Lactiplantibacillus plantarum Lp05 doses on cecal microbiome diversity. (A) Cladogram from metagenomic data and LEfSe analysis showing taxa with significant differences, with circle sizes reflecting taxa abundance. (B) STAMP analysis identifies genus-level differences within the intestinal microbiome. (C) PICRUSt predicts functions of KEGG level 2 taxa in the intestinal microbiome. Groups, CTL (control), MC (H. pylori infection model), Lp05_L (low dose, 2×10⁷ CFU), Lp05_M (medium dose, 2×10⁸ CFU), Lp05_H (high dose, 2×10⁹ CFU).
Figure 10
Figure 10
Presents the correlation analysis of differential microbial genera between gastric and intestinal microbiomes. Using Spearman's rank correlation test, the heatmap indicates significance levels with *** for p < 0.001, ** for p < 0.01, and * for p < 0.05.

Similar articles

References

    1. Crowe SE. Helicobacter pylori infection. New Engl J Med. (2019) 380:1158–65. doi: 10.1056/NEJMcp1710945 - DOI - PubMed
    1. Hooi JKY, Lai WY, Ng WK, Suen MMY, Underwood FE, Tanyingoh D, et al. . Global prevalence of helicobacter pylori infection: systematic review and meta-analysis. Gastroenterology. (2017) 153:420–9. doi: 10.1053/j.gastro.2017.04.022 - DOI - PubMed
    1. FitzGerald R, Smith SM. An overview of helicobacter pylori infection. In: Smith SM, editor. Helicobacter pylori. Springer US, New York, NY: (2021). p. 1–14. - PubMed
    1. FitzGerald R, Smith SM. An overview of helicobacter pylori infection. Methods Mol Biol. (2021) 2283:1–14. doi: 10.1007/978-1-0716-1302-3_1 - DOI - PubMed
    1. Kao C-Y, Sheu B-S, Wu J-J. Helicobacter pylori infection: An overview of bacterial virulence factors and pathogenesis. Biomed J. (2016) 39:14–23. doi: 10.1016/j.bj.2015.06.002 - DOI - PMC - PubMed

MeSH terms