. 2025 Jan 17:12:1511190.
doi: 10.3389/fcell.2024.1511190. eCollection 2024.

GRHL2-HER3 and E-cadherin mediate EGFR-bypass drug resistance in lung cancer cells

Affiliations

GRHL2-HER3 and E-cadherin mediate EGFR-bypass drug resistance in lung cancer cells

Fumiya Ito et al. Front Cell Dev Biol. .

Abstract

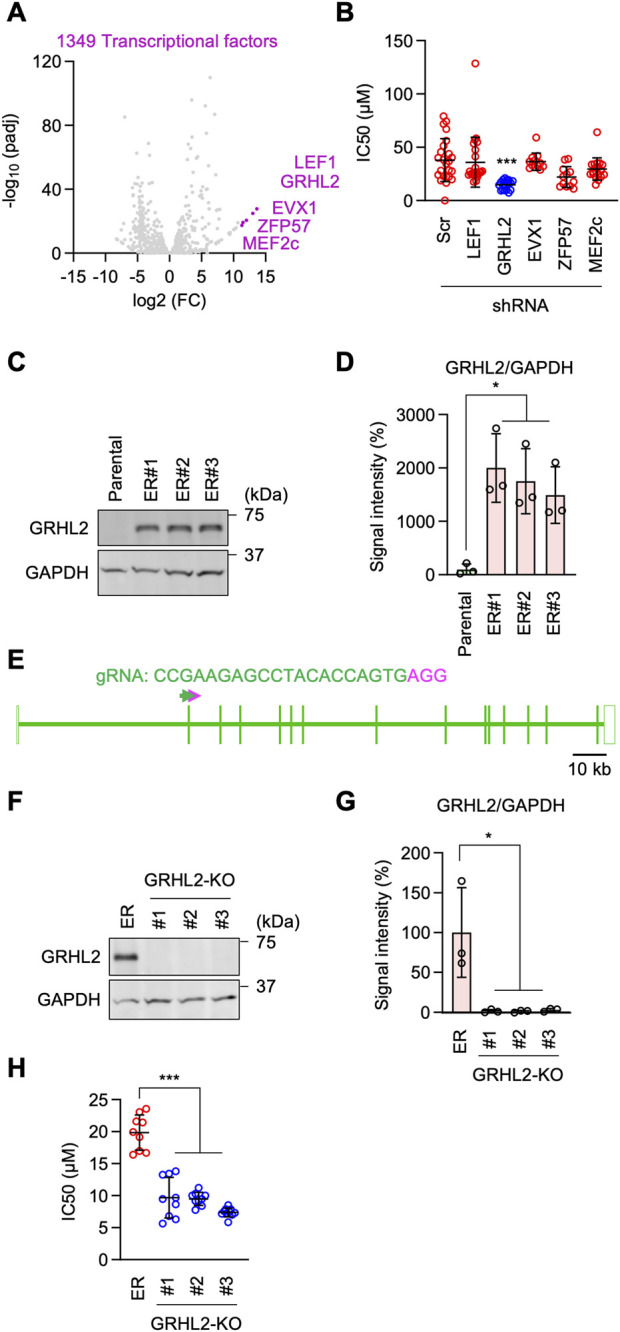
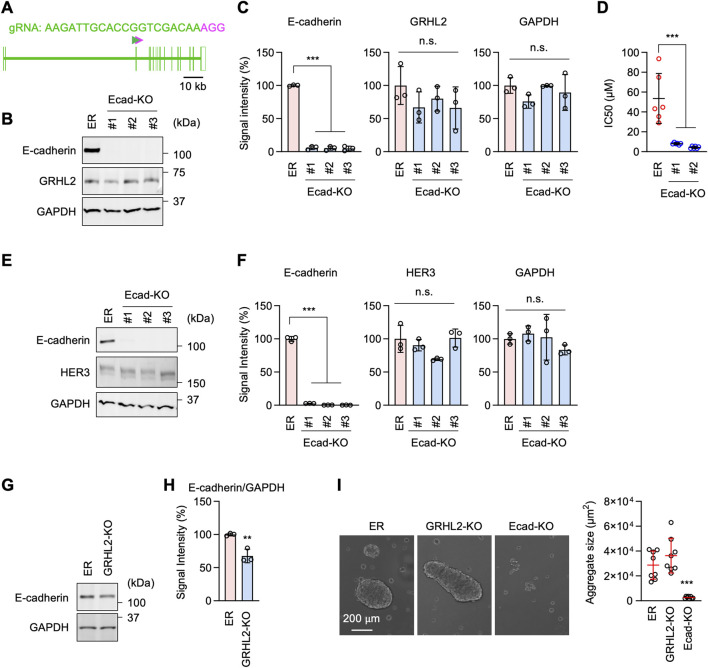
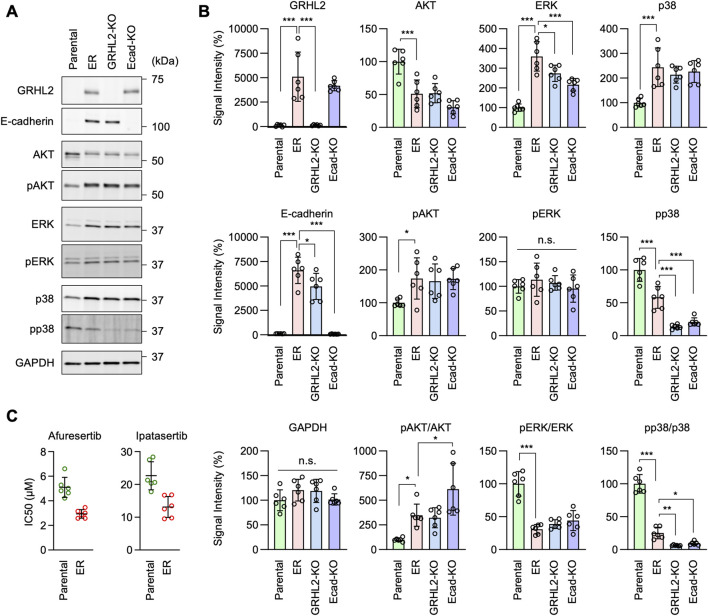
Epidermal growth factor receptor (EGFR) is a major oncogenic protein, and thus EGFR-targeting therapies are widely used in patients with various types of cancer, including lung cancer. However, resistance to EGFR inhibitors, such as erlotinib, presents a significant challenge in treating lung cancer. In this study, we established an EGFR-independent, erlotinib-resistant (ER) phenotype in lung cancer A549 cells by exposing them to erlotinib for an extended period. The resulting ER cells exhibited a dramatic increase in erlotinib resistance, a decreased EGFR protein level, and enhanced tumor growth, suggesting a robust mechanism bypassing EGFR inhibition. RNA sequencing identified the transcription factor GRHL2 as a critical player in this resistance. GRHL2 was upregulated in ER cells, and its knockdown and knockout significantly reduced erlotinib resistance. Further analysis revealed that GRHL2 upregulates the receptor tyrosine kinase HER3, and that HER3 knockdown similarly decreases the IC50 for erlotinib. Additionally, ER cells showed increased cell-cell adhesion, linked to upregulated E-cadherin. E-cadherin was found to be vital for erlotinib resistance, largely independent of GRHL2, highlighting multiple parallel pathways sustaining resistance. These findings provide a novel mechanism of drug resistance and suggest that combination therapies targeting both GRHL2-HER3 and E-cadherin-mediated pathways may be necessary to overcome erlotinib resistance in lung cancer.

Keywords: EGFR; GRHL2; HER3; cadherin; drug resistance; lung cancer.


Conflict of interest statement

The authors declare that the research was conducted in the absence of any commercial or financial relationships that could be construed as a potential conflict of interest. The author(s) declared that they were an editorial board member of Frontiers, at the time of submission. This had no impact on the peer review process and the final decision

Figures

FIGURE 1
FIGURE 1
Generation of erlotinib-resistant A549 cells. (A) Parental A549 cells were cultured in 10–30 µM erlotinib to select erlotinib-resistant cells (ER cells). (B) Parental and ER cells were cultured in 25 µM erlotinib for 72 h and stained with crystal violet. (C) Parental and three independent ER cell lines were cultured in the presence of 0–50 µM erlotinib for 72 h. Cell density was determined by crystal violet staining. Relative cell density is quantified. Values are mean ± SD (n = 18). (D) IC50 of Parental and ER cells is presented. Values are mean ± SD (n = 18 for Parental cells, n = 17 for ER cells). (E) Cell proliferation was assessed without erlotinib using crystal violet staining. Values are mean ± SD (n = 10). (F) Parental and ER spheroids were placed in Geltrex and monitored for 7 days (G) Quantification of the total area. Mean ± SD (n = 3). (H) Luciferase-expressing Parental and ER cells were subcutaneously injected into nude mice. For erlotinib treatment, mice were subjected to intraperitoneal injection at 25 mg/kg/day every Monday through Friday for 4 weeks. Bioluminescence was measured and quantified at the indicated time points. Mean ± SEM (n = 9 nontreated and 10 treated Parental cells and 10 nontreated and 9 treated ER cells). (I) Representative images of tumors generated from Parental and ER cells at 4 weeks (J) Tumor weight was measured. Mean ± SD (n = 11 nontreated and 10 treated Parental cells, 22 nontreated and 19 treated ER cells). (K) Western blotting of Parental and ER cells using antibodies to caspase-3, PARP, LC3, and GAPDH. (L) Quantification of band intensity. Mean ± SD (n = 3). One-way ANOVA with post hoc Tukey in (D, G, L) and Šídák (H), and two-tailed Student’s t-test in (J): *p < 0.05, **p < 0.01, ***p < 0.001.
FIGURE 2
FIGURE 2
EGFR-bypass resistance in ER cells. (A) Western blotting of Parental and ER cells using antibodies to EGFR and GAPDH. (B) Quantification of band intensity. Mean ± SD (n = 6). (C) The EGFR gene was cloned from the indicated cells and analyzed for mutations and deletions using DNA sequencing. One-way ANOVA with post hoc Tukey in (B): **p < 0.01.
FIGURE 3
FIGURE 3
Gene ontology analysis of RNA-seq data. (A) Gene ontology molecular function analysis of the DEGs in RNA-seq is presented. (B) Gene ontology analysis for biological processes is shown.
FIGURE 4
FIGURE 4
GRHL2 is critical for erlotinib resistance in ER cells. (A) A volcano plot showing transcription factors identified in RNA-seq analysis. The top five transcription factors are highlighted. (B) These five genes were knocked down in ER cells using shRNAs. IC50 against erlotinib was determined in each knockdown cell line. Mean ± SD (n = 24 for scramble, 24 for LEF1, 18 for GRHL2, 12 for EVX1, 12 for ZFP57, 18 for MEF2c). (C) Western blotting of Parental and ER cells using antibodies to GRHL2 and GAPDH. (D) Quantification of band intensity is shown. Mean ± SD (n = 3). (E) gRNA targeting exon 2 was used to knock out GRHL2 using CRISPR/Cas. (F) Western blotting of ER and three independent ER-GRHL2-KO cell lines using antibodies to GRHL2 and GAPDH. (G) Quantification of band intensity is shown. Mean ± SD (n = 3). (H) IC50 against erlotinib was determined in ER and ER-GRHL2-KO cells. Mean ± SD (n = 9 for ER, 9 for #1, 9 for #2, 10 for #3). One-way ANOVA with post hoc Tukey in (B, D, G, H): *p < 0.05, ***p < 0.001.
FIGURE 5
FIGURE 5
HER3 is upregulated by GRHL2 and mediates erlotinib resistance in ER cells. (A) Western blotting of Parental and ER cells using antibodies to HER3 and GAPDH. (B) Quantification of band intensity is shown. Mean ± SD (n = 3). (C) Western blotting of ER and ER-GRHL2-KO cells using antibodies to HER3 and GAPDH. (D) Quantification of band intensity is shown. Mean ± SD (n = 3). (E) qPCR analysis of HER3 expression in Parental, ER, and ER-GRHL2-KO cells. Quantification of HER3 transcript levels relative to GAPDH expression is shown. Mean ± SD (n = 3). (F) Gene knockdown of HER3 in ER cells. (G) Quantification of band intensity is shown. Mean ± SD (n = 3). (H) IC50 against erlotinib was determined in scramble and HER3 knockdown ER cells. Mean ± SD (n = 9). One-way ANOVA with post hoc Tukey in (B, E, G, H) and two-tailed Student’s t-test in (D): *p < 0.05, ***p < 0.001.
FIGURE 6
FIGURE 6
E-cadherin produces erlotinib resistance in ER cells. (A) Phase contrast microscopy of Parental and ER cells. (B) Parental and ER cells were incubated in non-adhesive cell culture plates for 24 h with gentle rotation. (C) The size of cell aggregates was quantified. Mean ± SD (n = 6). (D) Western blotting of Parental and ER cells using antibodies to E-cadherin, β-catenin, and GAPDH. (E) Quantification of band intensity is shown. Mean ± SD (n = 3). (F) Gene knockdown of E-cadherin in ER cells. (G) Quantification of band intensity is shown. Mean ± SD (n = 3). (H) Renilla luciferase (Rluc) and Ecad knockdown ER cells were analyzed in the cell-cell adhesion assay described in (B). (I) The size of cell aggregates was quantified. Mean ± SD (n = 6). One-way ANOVA with post hoc Tukey in (C, E) and two-tailed Student’s t-test in (G, I): *p < 0.05, **p < 0.01, ***p < 0.001.
FIGURE 7
FIGURE 7
E-cadherin-mediated erlotinib resistance is independent of GRHL2 and HER3. (A) gRNA targeting exon 3 was used to knock out E-cadherin using CRISPR/Cas. (B) Western blotting of ER and three independent ER-Ecad-KO cell lines using E-cadherin, GRHL2, and GAPDH antibodies. (C) Quantification of band intensity is shown. Mean ± SD (n = 3). (D) IC50 against erlotinib was determined in ER and ER-Ecad-KO cells. Mean ± SD (n = 6). (E) Western blotting of ER and three independent ER-Ecad-KO cell lines using E-cadherin, HER3, and GAPDH antibodies. (F) Quantification of band intensity is shown. Mean ± SD (n = 3). (G) Western blotting of ER and ER-GRHL2-KO cells using antibodies to E-cadherin and GAPDH. (H) Quantification of band intensity is shown. Mean ± SD (n = 3). (I) The cell-cell adhesion assay was performed using ER, ER-GRHL2-KO, and ER-Ecad-KO cells. The size of cell aggregates was quantified. Mean ± SD (n = 5). One-way ANOVA with post hoc Tukey in (C, D, F, I) and Student’s t-test in (H): *p < 0.05, **p < 0.01, ***p < 0.001.
FIGURE 8
FIGURE 8
AKT phosphorylation is important for erlotinib resistance in ER cells. (A) Western blotting of Parental, ER, ER-GRHL2-KO, and ER-Ecad-KO cells using the indicated antibodies. (B) Quantification of band intensity is shown. Mean ± SD (n = 5). (C) IC50 against afuresertib and ipatasertib was determined in Parental and ER cells. Mean ± SD (n = 6). One-way ANOVA with post hoc Tukey in (B) and Student’s t-test in (C): *p < 0.05, **p < 0.01, ***p < 0.001.
FIGURE 9
FIGURE 9
AKT phosphorylation is important for erlotinib resistance in ER cells. (A) Western blotting of Parental cells overexpressing GFP, HER3, E-cadherin, and both HER3 and E-cadherin using the indicated antibodies. (B) Quantification of band intensity is shown. Mean ± SD (n = 3). (C) IC50 against erlotinib was determined in the same set of cells. Mean ± SD (n = 18). One-way ANOVA with post hoc Tukey in (B, C): *p < 0.05, **p < 0.01, ***p < 0.001.

Similar articles

Cited by

References

    1. Adachi Y., Kato T., Yamada T., Murata D., Arai K., Stahelin R. V., et al. (2020). Drp1 tubulates the ER in a GTPase-independent manner. Mol. Cell 80 (4), 621–632. 10.1016/j.molcel.2020.10.013 - DOI - PMC - PubMed
    1. Alfarouk K. O., Stock C. M., Taylor S., Walsh M., Muddathir A. K., Verduzco D., et al. (2015). Resistance to cancer chemotherapy: failure in drug response from ADME to P-gp. Cancer Cell Int. 15, 71. 10.1186/s12935-015-0221-1 - DOI - PMC - PubMed
    1. Borst P. (2012). Cancer drug pan-resistance: pumps, cancer stem cells, quiescence, epithelial to mesenchymal transition, blocked cell death pathways, persisters or what? Open Biol. 2 (5), 120066. 10.1098/rsob.120066 - DOI - PMC - PubMed
    1. Cancer Genome Atlas Research N. (2014). Comprehensive molecular profiling of lung adenocarcinoma. Nature 511 (7511), 543–550. 10.1038/nature13385 - DOI - PMC - PubMed
    1. Chong C. R., Janne P. A. (2013). The quest to overcome resistance to EGFR-targeted therapies in cancer. Nat. Med. 19 (11), 1389–1400. 10.1038/nm.3388 - DOI - PMC - PubMed

LinkOut - more resources