. 2025 Jan 31;7(1):lqaf003.
doi: 10.1093/nargab/lqaf003. eCollection 2025 Mar.

GEMCAT-a new algorithm for gene expression-based prediction of metabolic alterations

Affiliations

GEMCAT-a new algorithm for gene expression-based prediction of metabolic alterations

Suraj Sharma et al. NAR Genom Bioinform. .

Abstract

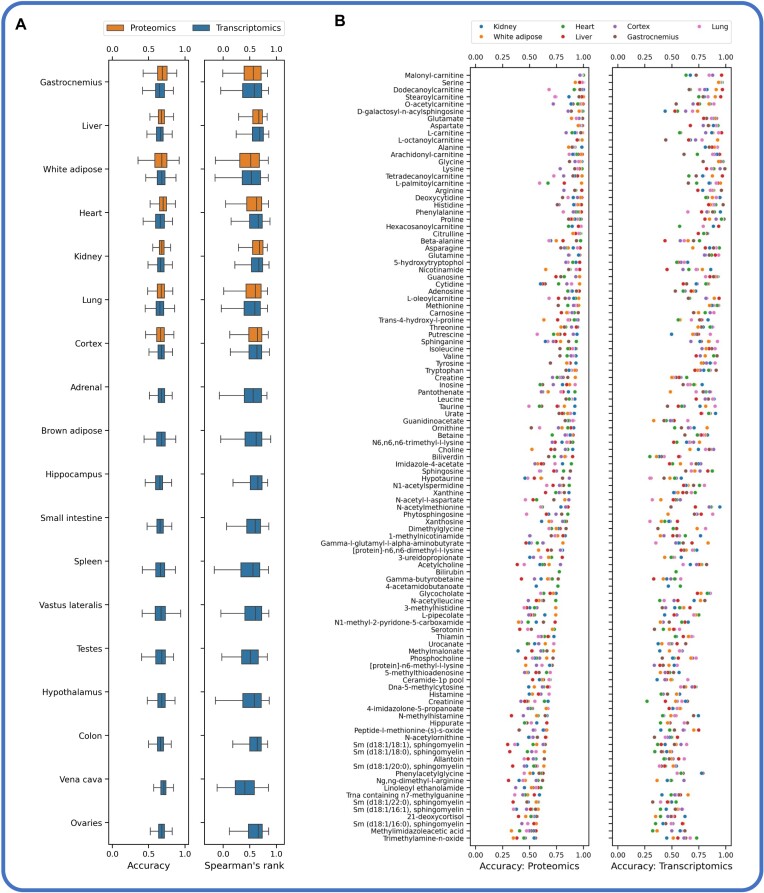
The interpretation of multi-omics datasets obtained from high-throughput approaches is important to understand disease-related physiological changes and to predict biomarkers in body fluids. We present a new metabolite-centred genome-scale metabolic modelling algorithm, the Gene Expression-based Metabolite Centrality Analysis Tool (GEMCAT). GEMCAT enables integration of transcriptomics or proteomics data to predict changes in metabolite concentrations, which can be verified by targeted metabolomics. In addition, GEMCAT allows to trace measured and predicted metabolic changes back to the underlying alterations in gene expression or proteomics and thus enables functional interpretation and integration of multi-omics data. We demonstrate the predictive capacity of GEMCAT on three datasets and genome-scale metabolic networks from two different organisms: (i) we integrated transcriptomics and metabolomics data from an engineered human cell line with a functional deletion of the mitochondrial NAD transporter; (ii) we used a large multi-tissue multi-omics dataset from rats for transcriptome- and proteome-based prediction and verification of training-induced metabolic changes and achieved an average prediction accuracy of 70%; and (iii) we used proteomics measurements from patients with inflammatory bowel disease and verified the predicted changes using metabolomics data from the same patients. For this dataset, the prediction accuracy achieved by GEMCAT was 79%.


Conflict of interest statement

None declared.

Figures

Figure 1.
Figure 1.
An overview of GEMCAT, our PR-assisted method to integrate transcriptomics or proteomics data to predict metabolic alterations in genome-scale metabolic models (human metabolic model, HMM). A stoichiometric matrix formula image and an adjacency matrix formula image can be derived from the reactions in a metabolic network. Thus, the metabolic network is represented as a directed graph composed of nodes (metabolites) linked by edges (enzymatic reactions). Upon integration of the gene expression data into the graph, PR centrality of every metabolite in the HMM is calculated. The differential PR centrality of metabolites is used to predict changes in their concentrations. The predicted metabolic alterations can be validated using the experimentally measured changes in the metabolomics data.
Figure 2.
Figure 2.
Comparison of predicted and measured changes in the abundance of metabolites in SLC25A51-deficient (293-SLC25A51-ko) cells relative to parental HEK293 cells. (A) A histogram showing the distribution of changes predicted in the abundance of 8399 metabolites in the HMM (Recon3D model) using RNA-seq data from three replicates. (B) A scatter plot showing the distribution of the mean of predicted metabolic changes calculated based on the integration of RNA-seq data from three replicates in comparison to the mean of the experimentally measured changes in metabolite concentrations in 293-SLC25A51-ko relative to parental HEK293 cells from five replicates (for details see the ‘Materials and methods’ section). The dashed lines are used to divide the plot into four quadrants. The upper right and lower left quadrants show metabolites, whose concentration changes are predicted correctly. In each quadrant, the percentage and names of metabolites corresponding to it are shown. Metabolite abbreviations: AMP, adenosine monophosphate; ATP, adenosine triphosphate; cAMP, cyclic AMP; 2,3-DPG, 2,3-diphosphoglyceric acid; 6PG, 6-phosphogluconic acid; S7P, d-sedoheptulose 7-phosphate; F16BP, fructose 1,6-bisphosphate; F6P, fructose 6-phosphate; G1P, glucose 1-phosphate; G6P, glucose 6-phosphate; PEP, phosphoenolpyruvic acid; SAM, S-adenosylmethionine; NAA, N-acetyl-l-aspartic acid; 3OHKYN, hydroxykynurenine.
Figure 3.
Figure 3.
Efficacy of GEMCAT in predicting training-induced metabolic alterations in rats. (A) A box plot representation of GEMCAT’s prediction accuracy distribution for >100 metabolites, compared to experimentally measured changes across various tissues. Accuracy is the ratio of correctly predicted metabolites to the total number of predictions. Prediction efficiency is further evaluated using Spearman’s rank coefficient, which ranges from −1 to +1, with 0 indicating no correlation. A coefficient of −1 or +1 implies an exact monotonic relationship. Each box represents the interquartile range, with the line inside the box indicating the median. The whiskers extend to show the distribution. (B) A dot plot distribution of mean accuracy per metabolite for the seven tissues that had metabolomics, proteomics, and transcriptomics data available. Detailed results for all metabolites are provided in the extended data sheets available at https://doi.org/10.6084/m9.figshare.28170524.
Figure 4.
Figure 4.
Comparison of predicted and measured changes in the abundance of metabolites in UC patients relative to healthy controls. (A) The histogram shows the distribution of predicted changes in all 8399 metabolites contained in the HMM. (B) A scatter plot showing the comparison of the predicted changes against the experimentally measured metabolic changes. The dashed lines separate the quadrants between correctly (upper right and lower left quadrants) and incorrectly predicted metabolites. All metabolites measured to be changed significantly (formula image [26]) and having a formula image are shown here. The complete results for 137 metabolites are provided in Supplementary Fig. S5 and data at https://doi.org/10.6084/m9.figshare.28170524. Metabolites are shown in orange and corresponding names are indicated in the respective quadrants. The percentage of metabolites in each quadrant is also shown. Metabolite abbreviations: 3OH-C16-C, 3-hydroxyhexadecanoylcarnitine; 3OH-IV-C, 3-hydroxyisovalerylcarnitine; 3OH-11Z-C18-C: 3-hydroxy-11Z-octadecenoylcarnitine; 3OH-C12-C, 3-hydroxydodecanoylcarnitine; 3OH-C14-C, 3-hydroxytetradecanoylcarnitine; C10-C, decanoylcarnitine; C8-C, L-octanoylcarnitine; 3OH-LC18, (3S)-3-hydroxylinoleoyl-CoA; IV-C, isovalerylcarnitine; NAA, N-acetyl-L-aspartic acid; A-LC18-C, alpha-linolenylcarnitine; C4-C, butyrylcarnitine; Tiglyl-C, tiglylcarnitine; Glutaryl-C, glutarylcarnitine; C6-C, hexanoylcarnitine; G3P, glycerol 3-phosphate.
Figure 5.
Figure 5.
Calculation of response coefficients (formula image) to trace metabolic alterations back to the underlying changes in gene expression. (A) Changes in metabolomics data mapped onto the human metabolic network. (B) The scatter plot is based on the comparison shown in Fig. 2B but limited to metabolites that show consistent predicted changes for three replicates of transcriptomics data and significant changes in the measurements (formula image, two-tailed Student’s t-test). Each dot represents the mean value of a metabolite. The bold lines highlight the upper right and bottom left quadrants, where the direction of the predicted changes agrees with the experimentally measured changes. In each quadrant, the percentage and names of metabolites corresponding to it are shown. (C) A heatmap showing the response coefficients (formula image) of correctly predicted metabolites.

Similar articles

References

    1. Ashburner M, Ball CA, Blake JA et al. . Gene Ontology: tool for the unification of biology. Eur J Biochem. 2000; 25:89–95. - PMC - PubMed
    1. Gene Ontology Consortium Aleksander SA, Balhoff J et al. . The Gene Ontology Knowledgebase in 2023. Genetics. 2023; 224:iyad031. - PMC - PubMed
    1. Lewis NE, Nagarajan H, Palsson BO. Constraining the metabolic genotype–phenotype relationship using a phylogeny of in silico methods. Nat Rev Microbiol. 2012; 10:291–305. - PMC - PubMed
    1. Blazier A, Papin J. Integration of expression data in genome-scale metabolic network reconstructions. Front Physiol. 2012; 3:299. - PMC - PubMed
    1. Nielsen J. Systems biology of metabolism. Annu Rev Biochem. 2017; 86:245–75. - PubMed

LinkOut - more resources