

Body composition and CO2 dietary emissions
- PMID: 39897182
- PMCID: PMC11782150
- DOI: 10.3389/fpubh.2024.1432109
Body composition and CO2 dietary emissions
Abstract
Background: The amount and quality of foods consumed not only impact on individual health, as reflected in body composition, but they could influence on greenhouse gas emissions and then, on environment.
Aim: This study aims to assess the relationship between the body composition and the CO2 emissions resulting from the dietary choices of an adult population.
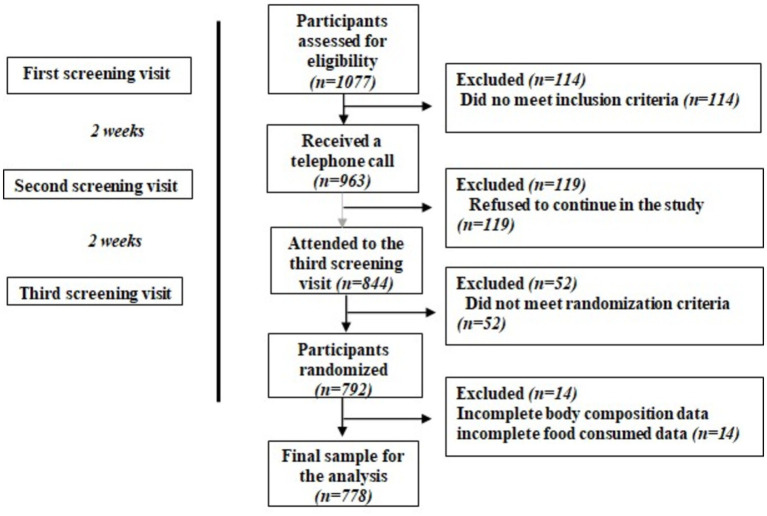
Design: A cross-sectional study on baseline data from 778 participants aged 55-75 years old, with metabolic syndrome (MetS) as part of the PREDIMED-Plus study.
Methods: Food intake was registered using a validated semi quantitative 143-item food frequency questionnaire. The amount of CO2 emitted was calculated using data from the Agribalyse® 3.0.1 database. Anthropometry (body weight, height, and waist, and hip circumference, and body mass index) was determined by usual measurements, and body composition (fat mass, visceral fat, muscular mass, fat free mass, and total body water) were assessed by bioimpedance.
Results: CO2 emissions were linearly and positively associated with weight, waist circumference, visceral fat, fat free mass, total body water and energy intake.
Conclusion: Body composition is associated with dietary CO2 emissions. The higher total body water, fat free mass, and body weight, the higher the dietary CO2 emissions were, following a linear relationship.
Clinical trial registration: http://www.isrctn.com/ISRCTN89898870, ISRCTN89898870.
Keywords: CO2 emissions; anthropometry; body composition; environment; sustainable diets.
Copyright © 2025 García, Monserrat-Mesquida, Mas-Fontao, Cuadrado-Soto, Ortiz-Ramos, Matía-Martín, Daimiel, Vázquez, Tur and Bouzas.
Conflict of interest statement
The authors declare that the research was conducted in the absence of any commercial or financial relationships that could be construed as a potential conflict of interest.
Figures

References
-
- United Nations (UN) . WMO: Greenhouse gas levels in atmosphere reach yet another high. New York, USA: UN; (2018).
-
- Leurent F. From food to foot: The energy and carbon flows of the human body at walking and cycling. (2022). Available at: https://hal.science/hal-03543183 [Accessed December 20, 2023].
-
- Gerber PJ, Steinfeld H, Henderson B, Mottet A, Opio C, Dijkman J, et al. . Tackling climate change through livestock–a global assessment of emissions and mitigation opportunities. Rome: Food and Agriculture Organization of the United Nations (FAO) (2013).
Publication types
MeSH terms
Substances
LinkOut - more resources
Full Text Sources