. 2025 Jan 6;15(5):1949-1965.
doi: 10.7150/thno.102682. eCollection 2025.

Betaine inhibits the stem cell-like properties of hepatocellular carcinoma by activating autophagy via SAM/m6A/YTHDF1-mediated enhancement on ATG3 stability

Affiliations

Betaine inhibits the stem cell-like properties of hepatocellular carcinoma by activating autophagy via SAM/m6A/YTHDF1-mediated enhancement on ATG3 stability

Chen Wang et al. Theranostics. .

Abstract

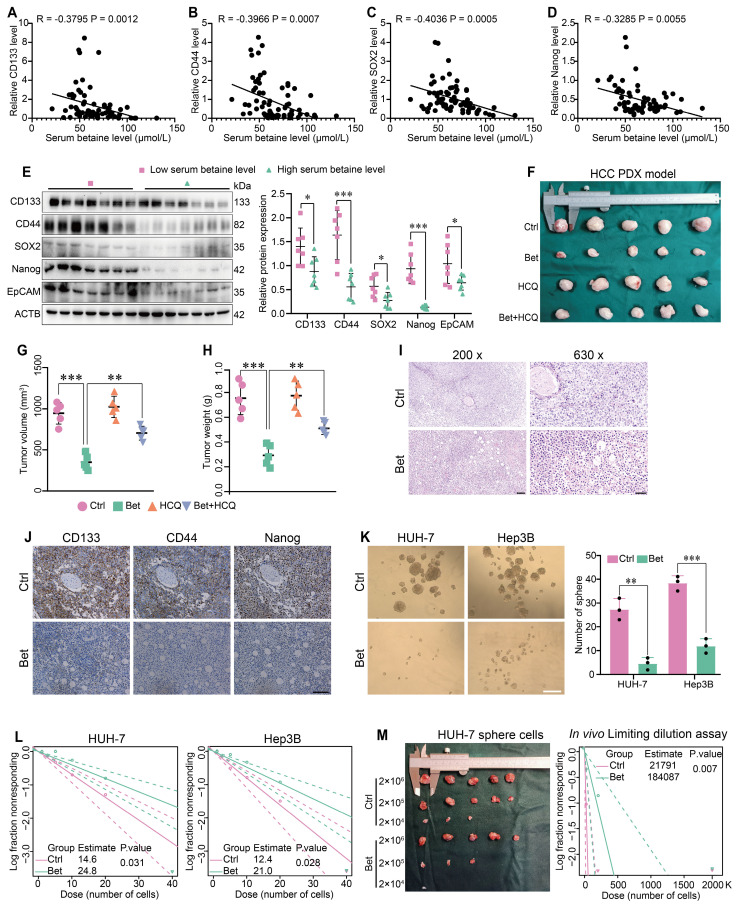
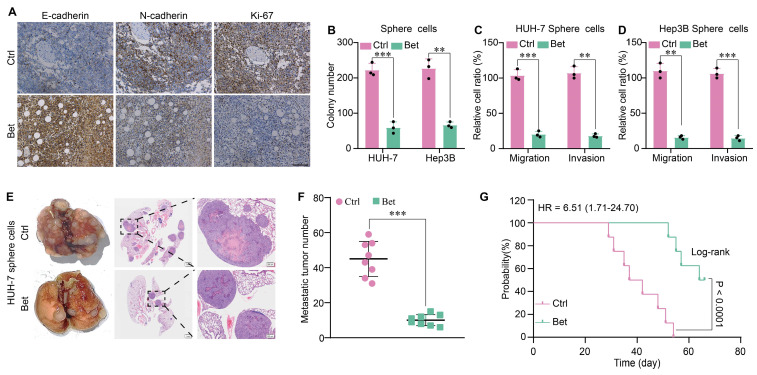
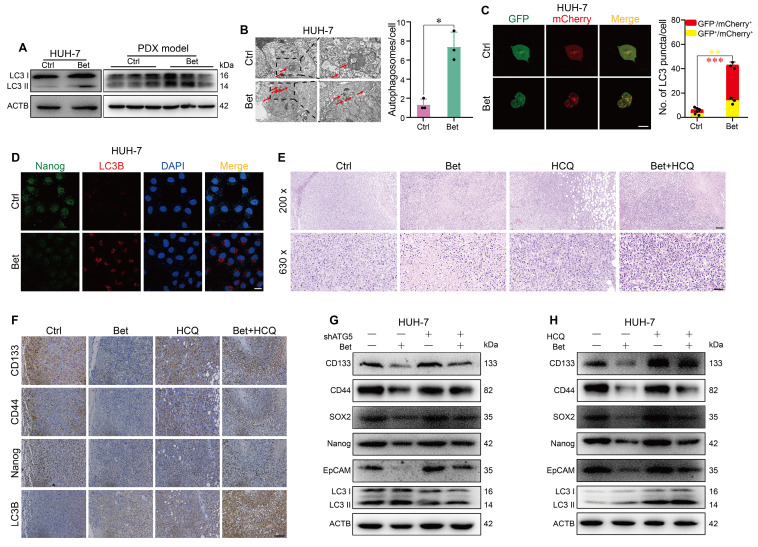
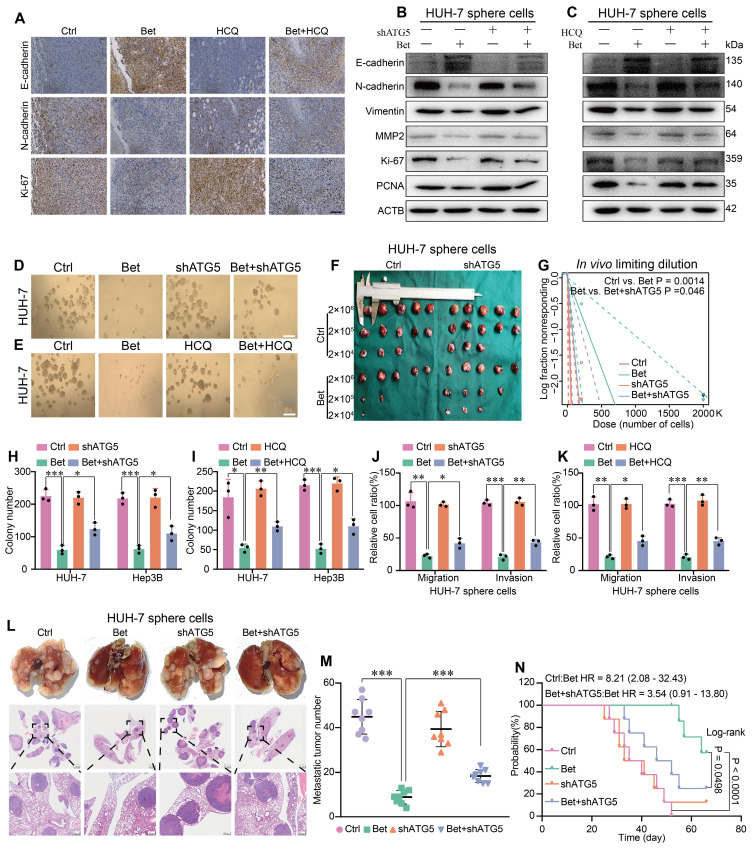
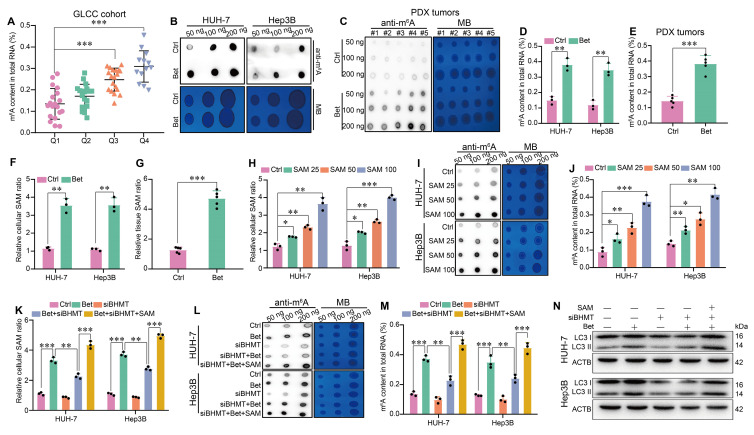
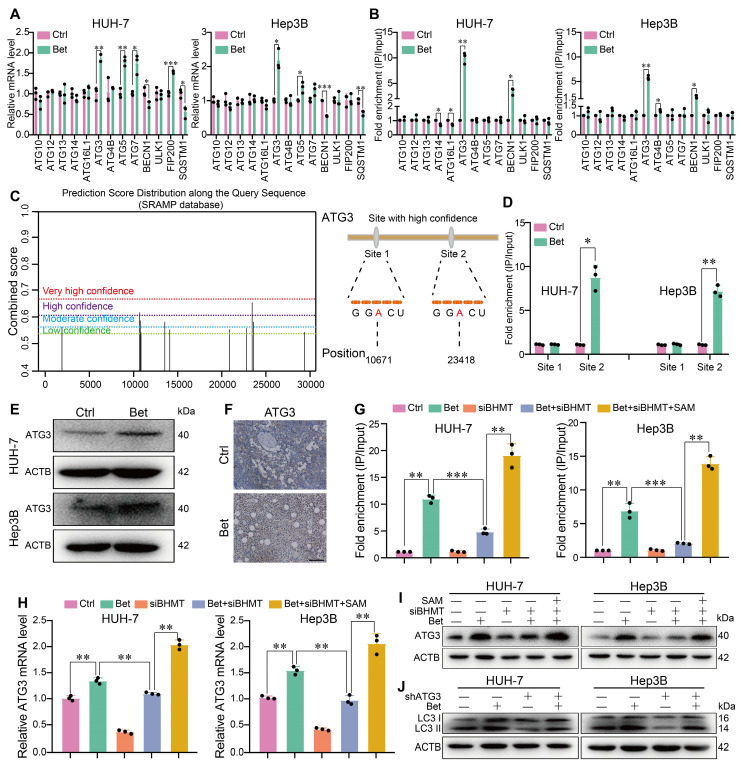
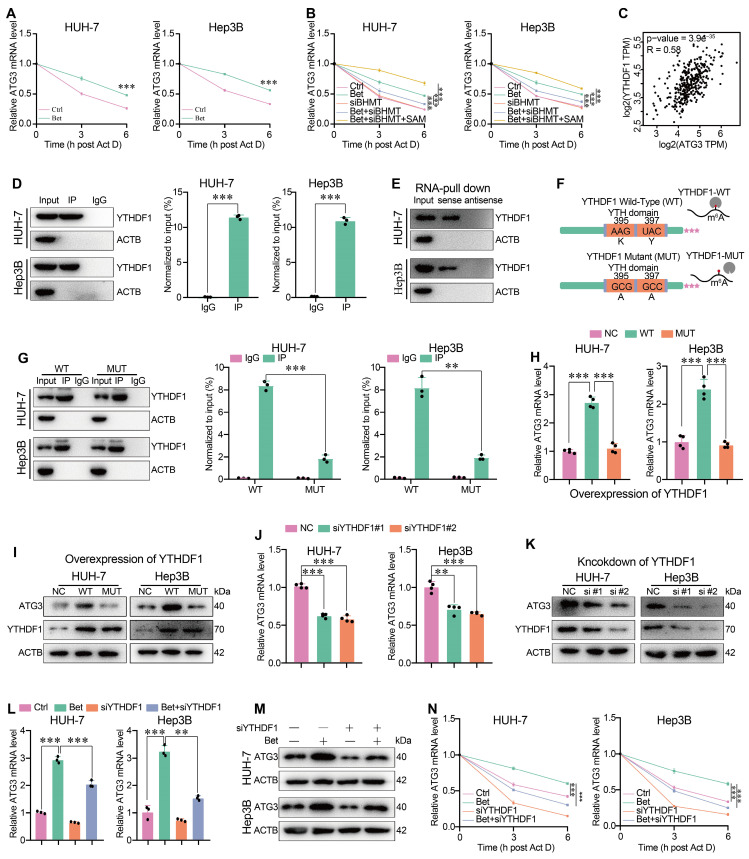
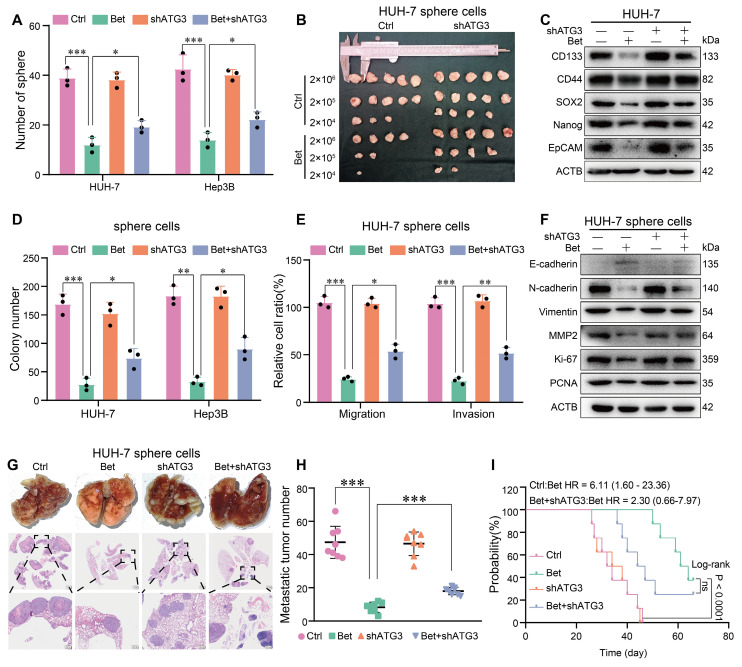
Background: Stem cell-like properties are known to promote the recurrence and metastasis of hepatocellular carcinoma (HCC), contributing to a poor prognosis for HCC patients. Betaine, an important phytochemical and a methyl-donor related substance, has shown protective effects against liver diseases. However, its effect on HCC stem cell-like properties and the underlying mechanisms remains uninvestigated. Methods: We measured the effects of betaine on the stem cell-like properties and malignant progression of HCC using patient-derived xenografts, cell-derived xenografts, tail vein-lung metastasis models, in vitro limiting dilution, tumor sphere formation, colony formation, and transwell assays. Mechanistic exploration was conducted using western blots, dot blots, methylated RNA immunoprecipitation-qPCR, RNA stability assays, RNA immunoprecipitation-qPCR, RNA pull-down, and gene mutation assays. Results: A cohort study of HCC found that a higher serum concentration of betaine was associated with decreased levels of stemness-related markers. Furthermore, in HCC cells and xenograft mice, betaine suppressed the stem cell-like properties of HCC by activating autophagy. Mechanistically, betaine increased the m6A modification in HCC by producing S-adenosylmethionine (SAM) via betaine-homocysteine S-methyltransferase (BHMT). This increase in SAM subsequently triggered autophagy by enhancing the stability of autophagy-related protein 3 (ATG3) via YTHDF1 in an m6A-dependent manner, thereby inhibiting the stem cell-like properties of HCC cells. Conclusions: These findings indicate that betaine inhibits the stem cell-like properties of HCC via the SAM/m6A/YTHDF1/ATG3 pathway. This study underscores the potential anti-tumor effects of betaine on HCC and offers novel therapeutic prospects for HCC patients.

Keywords: N6-methyladenosine; autophagy; betaine; hepatocellular carcinoma; stem cell-like properties.


Conflict of interest statement

Competing Interests: The authors have declared that no competing interest exists.

Figures

Figure 1
Figure 1
Betaine inhibits the stemness of HCC cells. (A-D) The correlation between serum betaine concentrations and the expression levels of stemness-related markers in HCC tissues from the GLCC cohort (n = 70) was analyzed using Pearson correlation coefficient. (E) HCC tissues were divided into four groups based on their serum betaine levels using the quartile method, seven HCC tissues were randomly chosen from the lowest quartile group to represent the low level of serum betaine group, and another seven HCC tissues were randomly selected from the highest quartile group to represent the high level of serum betaine group. The expression levels of CD133, CD44, SOX2, Nanog and EpCAM proteins were analyzed by WB assay. (F) Effects of betaine (Bet), HCQ, and Bet+HCQ on the growth of HCC were evaluated via an PDX model (n = 5/group). Tumor entity view. (G-H) Statistical analysis of tumor volume and tumor weight in PDX model among different groups. (I) HE staining of PDX tumor tissues (scale bars = 100 μm for left panel, and 40 μm for right panel). (J) IHC analysis of CD133, CD44, and Nanog in PDX tumor tissues with or without betaine treatment (scale bars = 100 μm). (K) Effects of betaine on the sphere formation ability of HCC cells were evaluated (scale bars = 100 μm). A statistical graph is shown. (L) Effects of betaine on the stemness of HCC cells were measured by in vitro limiting dilution assay (n = 18/group). (M) HCC cells were treated with betaine and subjected to sphere cells formation. Then, sphere cells were diluted in a gradient and injected subcutaneously into nude mice. The number of tumors in each group was counted after 30 days. The injected cell quantity and tumor formation frequency (n = 5 per group) were shown. *P < 0.05, **P < 0.01, ***P < 0.001.
Figure 2
Figure 2
Betaine inhibits the malignant progression of HCC. (A) IHC analysis of E-cadherin, N-cadherin, and Ki-67 in PDX tumor tissues with or without betaine treatment (scale bars = 100 μm). (B-D) HCC cells were treated with betaine and subjected to sphere cells formation, then sphere cells were dissociated and subjected to colony formation and transwell assays to detect their clonogenic, migrative and invasive capabilities. Statistical graphs are shown. (E) HCC cells were treated with betaine and subjected to sphere cells formation, then sphere cells were dissociated and 5×10⁶ of cells were injected into the tail vein of nude mice. After 66 days of injection, mice were humanely euthanized. Images of lung metastatic nodules and H&E staining are shown (scale bar = 1 mm for left panel, and 200 μm for right panel). (F) Quantitative results of lung metastatic nodules for the Bet and Ctrl groups. (G) Kaplan-Meier survival curve analysis of nude mice injected with HCC sphere cells (n = 8/group). HR: Hazard Ratio. **P < 0.01, ***P < 0.001.
Figure 3
Figure 3
Betaine inhibits the stem cell-like properties of HCC by activating autophagy. (A) After betaine treatment, the expression levels of LC3 I/II protein in HUH-7 cells and PDX tumor tissues were analyzed by WB assay. (B) HUH-7 cells were treated with betaine, and the intracellular autophagosomes were captured via a TEM (scale bar = 2 μm for left panel and 1 μm for right panel). A statistical graph is shown. (C) HUH-7 cells were pre-transfected with mCherry-GFP-LC3B, and then subjected to betaine treatment. The red and yellow puncta were captured by a confocal microscope and quantitated (scale bar = 20 μm). A statistical graph is shown. (D) HUH-7 cells were treated with betaine, the expression levels of Nanog and LC3B proteins in the same cells were detected by IF assay (scale bar = 20 μm). (E) HE staining of PDX tumor tissues (scale bar = 100 μm for upper panel, 40 μm for lower panel). (F) After being exposed to betaine, HCQ, or combined betaine and HCQ treatments, IHC analysis of CD133, CD44, Nanog, and LC3B in PDX tumors (scale bars = 100 μm). (G) HUH-7 cells were pre-transfected with shATG5, and then subjected to betaine treatment. The expression levels of CD133, CD44, SOX2, Nanog, EpCAM, and LC3B proteins were analyzed by WB assay. (H) HUH-7 cells were subjected to betaine, HCQ or combined betaine and HCQ treatments, and the expression levels of CD133, CD44, SOX2, Nanog, EpCAM, and LC3B proteins were analyzed by WB assay. *P < 0.05, **P < 0.01, ***P < 0.001.
Figure 4
Figure 4
Inhibition of autophagy impairs the antitumor effects of betaine on HCC. (A) IHC results of E-cadherin, N-cadherin, and Ki-67 in PDX tumor tissues (scale bars = 100 μm). (B-C) WB analysis of the expression levels of E-cadherin, N-cadherin, Vimentin, MMP2, Ki-67, and PCNA proteins in HUH-7 sphere cells. (D) HUH-7 cells were pre-transfected with shATG5, and then were subjected to betaine treatment. The tumor sphere formation ability of HUH-7 cells under different treatments was measured (scale bars = 100 μm). (E) HUH-7 cells were subjected to betaine, HCQ, or combined betaine and HCQ treatments, and the tumor sphere formation ability of HUH-7 cells under different treatments was measured (scale bars = 100 μm). (F-G) HUH-7 cells were pre-transfected with shATG5 and subjected to betaine treatment for generation of sphere cells. Then, HUH-7 sphere cells were diluted in a gradient and injected subcutaneously into nude mice. The number of tumors in each group was counted after 30 days. The injected cell quantity and tumor formation frequency (n = 5 per group) were shown. (H-K) HUH-7 cells were pre-transfected with shATG5 or treated with HCQ, then subjected to betaine treatment for generation of sphere cells. After being dissociated and diluted, sphere cells were subjected to colony formation, and transwell migration and invasion assays. Statistical graphs are shown. (L) HUH-7 cells were pre-transfected with shATG5 and subjected to betaine treatment for generation of sphere cells. After being dissociated and diluted, 5×10⁶ of cells were injected into the tail vein of nude mice. After 66 days of injection, mice were humanely euthanized. Images of lung metastatic nodules and H&E staining were shown (scale bar = 1 mm for upper panel, and 200 μm for lower panel). (M) Quantitative results of lung metastatic nodules in different groups. (N) Kaplan-Meier survival curve analysis of nude mice injected with HCC cells in different groups (n = 8/group). HR: Hazard Ratio. *P < 0.05, **P < 0.01, ***P < 0.001.
Figure 5
Figure 5
Betaine activates autophagy via SAM-mediated m6A modification. (A) HCC tissues from GLCC cohort (n = 70) were divided into four groups based on their serum betaine levels using the quartile method, and the levels of m6A modification in HCC tissues of these four groups (Q1 for quartile 1 group, Q2 for quartile 2 group, Q3 for quartile 3 group, Q4 for quartile 4 group) were detected. (B-E) The effects of betaine exposure on the m6A modification in HCC cells and PDX tumor tissues were detected using dot blot and quantified using the EpiQuik m6A methylation quantification kit, respectively. (F-G) After being exposed to betaine, the concentration of SAM in HCC cells and PDX tumor tissues was detected by a SAM ELISA kit. (H) HCC cells were treated with various concentrations of SAM (0, 25, 50, and 100 μM), and the concentration of SAM in HCC cells was detected by a SAM ELISA kit. (I-J) HCC cells were treated with various concentrations of SAM, and the m6A modification in HCC cells was detected using dot blot and quantified using the EpiQuik m6A methylation quantification kit, respectively. (K-N) HCC cells were pre-transfected with siBHMT, and then subjected to betaine or combined betaine and SAM treatments. The SAM levels, m6A modification, and LC3 I/II protein levels in HCC cells were detected via SAM ELISA kit, dot blot, EpiQuik m6A methylation quantification kit, and WB assay, respectively. *P < 0.05, **P < 0.01, ***P < 0.001.
Figure 6
Figure 6
Betaine activates autophagy via SAM-mediated m6A modification on ATG3 mRNA. (A) The effects of betaine exposure on the expression levels of autophagy-related genes in HCC cells were detected by qPCR analysis. (B) After treatment with betaine, MeRIP-qPCR assay was performed to measure the level of m6A-modified ATGs in HCC cells. (C) m6A modification sites in ATG3 mRNA were predicted via SRAMP database and those with high confidence were selected for further investigation. (D) After treatment with betaine, the level of m6A modification in these two sites of ATG3 mRNA in HCC cells was detected using MeRIP-qPCR assay. (E-F) After treatment with betaine, the expression levels of ATG3 protein in HCC cells and PDX tumor tissues were measured using WB and IHC assays (Scale bar = 100 μm), respectively. (G-I) HCC cells were pre-transfected with siBHMT, and then were subjected to betaine or combined betaine and SAM treatments. The level of m6A modification in ATG3 mRNA, as well as the expression levels of ATG3 mRNA and protein, were detected using MeRIP-qPCR, qPCR, and WB assays, respectively. (J) HCC cells were pre-transfected with shATG3, and then were subjected to betaine treatment, the expression levels of LC3 I/II proteins were detected using WB assay. *P < 0.05, **P < 0.01, ***P < 0.001.
Figure 7
Figure 7
Betaine promotes ATG3 mRNA stability via SAM/m6A/YTHDF1-dependent manner. (A) After treatment with betaine, HCC cells were treated with 5 μg/mL of Act D for 0, 3, and 6 h, respectively. The expression levels of ATG3 mRNA at these different time points were detected using qPCR assay. (B) After pre-transfection with siBHMT, HCC cells were subjected to betaine or combined betaine and SAM treatments. Then, 5 μg/mL of Act D was added for further treatment for 0, 3, and 6 h, respectively. The expression levels of ATG3 mRNA at these different time points were detected using qPCR assay. (C) The correlation between ATG3 and YTHDF1 in HCC tissues was assessed using online GEPIA 2 database. (D) The interaction between ATG3 mRNA and YTHDF1 protein was analyzed using RIP-qPCR assay, and the RIP-derived protein and ATG3 mRNA in HCC cells were detected by WB and qPCR assays, respectively. (E) The interaction between ATG3 mRNA and YTHDF1 protein was confirmed by RNA pull-down assay, and the protein derived from the RNA pull-down assay in HCC cells was detected using WB assay. (F) Schematic graph of the YTHDF1 wild-type (YTHDF1-WT) and the mutant of YTHDF1 m6A-binding pocket (YTHDF1-MUT) construction. (G) HCC cells were pre-transfected with YTHDF1-WT and YTHDF1-MUT overexpressed plasmids, and the interaction between ATG3 mRNA and YTHDF1 was analyzed via RIP-qPCR assay. (H and I) HCC cells were transfected with YTHDF1-WT and YTHDF1-MUT overexpressed plasmids, and the expression levels of ATG3 mRNA as well as the levels ATG3 and YTHDF1 proteins were detected using qPCR and WB assays, respectively. (J and K) HCC cells were transfected with siYTHDF1, and the expression levels of ATG3 mRNA as well as the levels of ATG3 and YTHDF1 proteins were detected using qPCR and WB assays, respectively. (L-M) HCC cells were pre-transfected with siYTHDF1, and then were subjected to betaine treatment. The expression levels of ATG3 mRNA and protein were detected using qPCR and WB assays, respectively. (N) After pre-transfection with siYTHDF1, HCC cells were subjected to betaine treatment. Then, 5 μg/mL of Act D was added for further treatment for 0, 3, and 6 h, respectively. The expression levels of ATG3 mRNA at these different time points were detected using qPCR assay. **P < 0.01, ***P < 0.001.
Figure 8
Figure 8
betaine inhibits the stem cell-like properties of HCC via ATG3. (A) HUH-7 cells were pre-transfected with shATG3 and subjected to betaine treatment. The tumor sphere formation ability of HUH-7 cells under different treatments was measured. A statistical graph is shown. (B) HUH-7 cells were pre-transfected with shATG3 and subjected to betaine treatment for generation of sphere cells. Then, HUH-7 sphere cells were diluted in a gradient and injected subcutaneously into nude mice. The number of tumors in each group was counted after 30 days. The injected cell quantity and tumor formation frequency (n = 5 per group) were shown. (C) HUH-7 cells were pre-transfected with shATG3, and then subjected to betaine treatment. The expression levels of CD133, CD44, SOX2, Nanog, and EpCAM proteins in HUH-7 cells were detected using WB assay. (D-E) HUH-7 cells were pre-transfected with shATG3 and subjected to betaine treatment for generation of sphere cells. After being dissociated and diluted, sphere cells were subjected to colony formation, and transwell migration and invasion assays. Statistical graphs are shown. (F) WB analysis of the expression levels of E-cadherin, N-cadherin, Vimentin, MMP2, Ki-67, and PCNA proteins in HUH-7 sphere cells under different treatments. (G) HUH-7 cells were pre-transfected with shATG3 and subjected to betaine treatment for generation of sphere cells. After being dissociated and diluted, 5×10⁶ of cells were injected into the tail vein of nude mice. After 66 days of injection, mice were humanely euthanized. Images of lung metastatic nodules and H&E staining were shown (scale bar = 1 mm for upper panel, and 200 μm for lower panel). (H) Quantitative results of lung metastatic nodules in different groups. (I) Kaplan-Meier survival curve analysis of nude mice injected with HCC cells in different groups (n = 8/group). HR: Hazard Ratio; ns: not significant. *P < 0.05, **P < 0.01, ***P < 0.001.

References

    1. Sung H, Ferlay J, Siegel RL, Laversanne M, Soerjomataram I, Jemal A. et al. Global Cancer Statistics 2020: GLOBOCAN Estimates of Incidence and Mortality Worldwide for 36 Cancers in 185 Countries. CA Cancer J Clin. 2021;71:209–49. - PubMed
    1. Vogel A, Meyer T, Sapisochin G, Salem R, Saborowski A. Hepatocellular carcinoma. Lancet. 2022;400:1345–62. - PubMed
    1. Zhan H, Zhao X, Lu Z, Yao Y, Zhang X. Correlation and Survival Analysis of Distant Metastasis Site and Prognosis in Patients With Hepatocellular Carcinoma. Front Oncol. 2021;11:652768. - PMC - PubMed
    1. Yoon JH, Choi SK, Cho SB, Kim HJ, Ko YS, Jun CH. Early extrahepatic recurrence as a pivotal factor for survival after hepatocellular carcinoma resection: A 15-year observational study. World J Gastroenterol. 2022;28:5351–63. - PMC - PubMed
    1. Niu Q, Ye S, Zhao L, Qian Y, Liu F. The role of liver cancer stem cells in hepatocellular carcinoma metastasis. Cancer Biol Ther. 2024;25:2321768. - PMC - PubMed

MeSH terms