. 2025 Jan 2;15(5):1842-1863.
doi: 10.7150/thno.104282. eCollection 2025.

Chronic stress induces depression through MDGA1-Neuroligin2 mediated suppression of inhibitory synapses in the lateral habenula

Affiliations

Chronic stress induces depression through MDGA1-Neuroligin2 mediated suppression of inhibitory synapses in the lateral habenula

Xuehui Wang et al. Theranostics. .

Abstract

Rationale: The hyperactivity of lateral habenula (LHb) has been implicated in the pathophysiology of depression, but the regulatory mechanisms of inhibitory synapses in this context remains unclear. MDGA1 and neuroligin2 (Nlgn2), both regulators of inhibitory synapses, selectively interact in the LHb. We aimed to investigate if their interaction contributes to chronic restrained stress (CRS)-induced depression by modulating inhibitory synapses. Methods: Transgenic mouse models were established to conditional knockout/recover of MDGA1 expression or knockin Nlgn2 variant incapable of binding MDGA1 in the LHb, using viral Cre-recombinase expression. Synaptic function and density were assessed through electrophysiology and immunostaining, respectively. An acute restrained stress (ARS) model and chemogenetic activation of the lateral hypothalamus (LH) were used to stimulate the LHb. Behavioral tests related to depression were conducted following CRS. Results: MDGA1 and Nlgn2 selectively interacted in the LHb, which was elevated following CRS. Germline knockout of MDGA1 increased inhibitory transmission and GABAergic synapse density in the LHb, effects that were reversed by adult re-expression of MDGA1. Introduction of the Nlgn2 variant incapable of binding MDGA1 similarly enhanced inhibitory transmission and increased GABAergic synapse density in the LHb. Both germline MDGA1 deficiency and introduction of the Nlgn2 variant mitigated ARS- and LH activation-induced LHb neuron hyperactivation. MDGA1 deficiency in the LHb during adulthood increased inhibitory synaptic strength and conferred significant resistance to CRS-induced depressive behaviors, similar to the effects of introducing the Nlgn2 variant in the LHb. Conclusions: Our findings suggests that MDGA1-mediated suppression of Nlgn2 facilitates depression onset through limiting GABAergic synapse formation within the LHb. Targeting MDGA1/Nlgn2 complexes residing at GABAergic synapses within the lateral habenula may be viable for alleviating core behavioral symptoms of major depression.

Keywords: Depression; Inhibitory synapses; Lateral habenula; MDGA1; Nlgn2; Stress.


Conflict of interest statement

Competing Interests: The authors have declared that no competing interest exists.

Figures
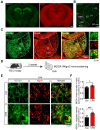
Figure 1
Figure 1
MDGA1 and Nlgn2 co-localize within the LHb, which is increased following CRS. (A) Representative MDGA1 and Nlgn2 immunofluorescence staining images of mouse coronal brain sections. (B) MDGA1 immunofluorescence staining in the lateral hypothalamus. (C) Representative MDGA1 and Nlgn2 immunofluorescence staining images in the LHb. (D) Schematic diagram of the experimental procedure. (E) High magnification photomicrographs obtained from the LHb of control and CRS mice showing MDGA1 (green) and Nlgn2 (red) labeling. (F) The amount of MDGA1 colocalized with Nlgn2 in the LHb is significantly increased following CRS (top graph) and the expression of MDGA1 in LHb is also increased following CRS (bottom graph). n = 8 mice for control group, n = 7 mice for CRS group; unpaired t test, p = 0.0166 (top), p = 0.0006 (bottom). Data are presented as the mean ± SEM. *p < 0.05, ***p < 0.001.
Figure 2
Figure 2
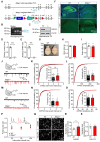
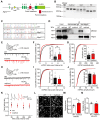
MDGA1 deficiency increases inhibitory but not excitatory synaptic inputs onto neurons in the LHb. (A) Strategy for generation of Mdga1-/- mice, β-galactosidase (LacZ) and neomycin (neo) gene fragments are inserted between exons 4 and 5 of MDGA1. Black arrows indicate forward and reverse primers used for genotyping. (B) PCR genotyping of genomic DNA from Mdga1+/-, Mdga1-/- and WT mice using forward and reverse primers which flank the loxp site and show a wild-type (WT) band at 216 bp and a flox-inserted band at 250 bp. (C) Representative immunoblots of hippocampal lysates. (D) Quantification of protein levels from (C). (E) Quantitative RT-PCR analyses of MDGA1 mRNA levels in WT and Mdga1-/- mice. (F) MDGA1 and β-galactosidase staining of WT and Mdga1-/- mouse brain. The inserted LacZ is expressed from the Mdga1 locus. (G-I) Representative images of whole brains and quantification of brain size and weights of WT and Mdga1-/- mice at P56. (J) Schematic showing patch-clamp recording performed in the neurons of LHb (top) and representative mIPSC traces (bottom). (K) Mdga1-/- neurons exhibited a significant increase in mIPSC frequency relative to WT. n = 32 neurons, from 4 mice for WT; n = 29 neurons, from 4 mice for Mdga1-/-; unpaired t test, p = 0.0074. (L) mIPSC amplitude did not differ significantly between groups. Unpaired t test, p = 0.4255. (M-O) Schematic showing patch-clamp recordings performed in the neurons of LHb (top) and representative mEPSC traces (bottom) (M). Neither the frequency (I; unpaired t test, p = 0.6427) nor the amplitude (O; unpaired t test, p = 0.6613) was altered in Mdga1-/- neurons relative to WT. n = 15 neurons, from 4 mice for WT; n = 17 neurons, from 4 mice for Mdga1-/-. (P) Paired pulse ratios plotted against inter-stimulus intervals. Representative traces of eIPSC paired-pulse stimulation at a 50 ms interval are shown (inset). There was not a significant difference between groups. n = 17 neurons, 4 mice for both genotypes; two-way ANOVA, p = 0.1743, F (1, 96) = 1.8730. (Q) Representative confocal images from LHb immunolabeled for GAD65 and VGLUT2. (R) Quantification of punctate integrated intensity per tissue area showed a significant increase in GAD65 in the LHb of Mdga1-/- mice. n = 7 mice for WT group, n = 6 mice for Mdga1-/- group; unpaired t test, p = 0.0199. (S) Quantification of punctate integrated intensity per tissue area showed no changes in VGLUT2 in the LHb of Mdga1-/- mice. n = 7 mice for WT group, n = 6 mice for Mdga1-/- group; unpaired t test, p = 0.6985. Data are presented as the mean ± SEM. *p < 0.05, **p < 0.01, unpaired t test.
Figure 3
Figure 3
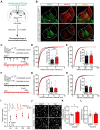
Conditional KO of Mdga1 in the LHb increases inhibitory synaptic transmission and GABAergic synaptic density. (A) Schematic diagram of the experimental procedure. (B) Immunohistochemical staining of MDGA1 in each group shows that MDGA1 expression was significantly decreased in the LHb after Cre-recombinase expression. (C) Schematic diagram of recording (top) and representative mIPSCs traces (bottom). (D) KO neurons exhibited a significant increase in mIPSC frequency relative to control EGFP neurons. n = 20 neurons, from 4 mice for EGFP, n = 30 neurons, from 6 mice for Cre; unpaired t test, p = 0.0034. (E) mIPSC amplitude did not differ between the Cre and EGFP groups. n = 20 neurons, from 4 mice for EGFP, n = 30 neurons, from 6 mice for Cre; unpaired t test, p = 0.1332. (F) Schematic diagram of recording procedure (top) and representative mEPSCs traces (bottom) (G) mEPSC frequency did not differ between the Cre and EGFP groups. n = 17 neurons, from 3 mice for EGFP, n = 19 neurons, from 4 mice for Cre; unpaired t test, p = 0.5251. (H) mEPSC amplitude did not differ between the Cre and EGFP groups. n = 17 neurons, from 3 mice for EGFP, n = 19 neurons, from 4 mice for Cre; unpaired t test, p = 0.1799. (I) Paired-pulse ratio of evoked IPSCs was not significantly different between groups. eIPSC paired-pulse ratio (PPR) traces at a 50 ms interval (inset). n = 12 neurons, from 3 mice for each group; two-way ANOVA, p = 0.8085, F (1, 88) = 0.0591. (J) Representative confocal images from LHb of EGFP and Cre brain sections immunolabeled with inhibitory presynaptic marker GAD65 and excitatory presynaptic marker VGLUT2 are shown. (K) Quantification of punctate integrated intensity per tissue area shows a significant increase in GAD65 in LHb of Cre mice. n = 7 mice for EGFP group, n = 6 mice for Cre group; unpaired t test, p = 0.0354. (L) Quantification of punctate integrated intensity per tissue area showed no change in VGLUT2 in LHb of Cre mice. n = 7 mice for EGFP group, n = 6 mice for Cre group; unpaired t test, p = 0.4821. Data are presented as the mean ± SEM. *p < 0.05, **p < 0.01, unpaired t test.
Figure 4
Figure 4
Rescuing MDGA1 expression in adult Mdga1 KO LHb decreases inhibitory synaptic strength. (A) Strategy used to re-express MDGA1 in Mdga1-/- mice. (B) Schematic diagram of the experimental procedure is shown. (C) Immunohistochemical staining of MDGA1 showed that MDGA1 was re-expressed in Mdga1-/- mice infected with rAAV-hSyn-EGFP-Flp in LHb compared to Mdga1-/- mice infected with rAAV-hSyn-EGFP. Scale bar, 100 μm. (D) Schematic diagram of recording procedure (top) and representative mEPSCs traces (bottom). (E) Rescuing MDGA1 in LHb decreased mIPSC frequency. n = 22 neurons, from 4 mice for EGFP, n = 28 neurons, from 4 mice for Flp; unpaired t test, p = 0.0011. (F) Rescuing MDGA1 in LHb did not alter mIPSC amplitude. n = 22 neurons, from 4 mice for EGFP, n = 28 neurons, from 4 mice for Flp; unpaired t test, p = 0.1095. (G) Representative confocal images from LHb immunolabeled for GAD65 and VGLUT2. (H) Quantification of punctate integrated intensity per tissue area showed a significant decrease in GAD65 in the LHb of Flp mice. n = 5 mice for EGFP group, n = 4 mice for Flp group; unpaired t test, p = 0.0028. (I) Quantification of punctate integrated intensity per tissue area shows no changes in VGLUT2 in the LHb of Flp mice. n = 5 mice for EGFP group, n = 4 mice for Flp group; unpaired t test, p = 0.7250. Data are presented as the mean ± SEM. **p < 0.01, unpaired t test.
Figure 5
Figure 5
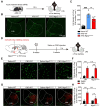
Knockout of Mdga1 confers resistance to ARS-induced activation of the LHb and the chemogenetic activation of LH-LHb pathway. (A) Schematic diagram of the experimental procedure is shown. (B) Representative images of c-Fos immunoreactivity in each group. (C) The density of c-Fos-positive cells in the LHb of WT was significantly increased after exposure to ARS when comparing naive animals, and the Mdga1 KO was resistant to the ARS-induce activation of LHb. n = 3 mice for Naive, n = 6 mice for ARS-WT, n = 6 mice for ARS-Mdga1-/-. (D) Schematic diagram of the experimental procedure. (E) Confocal image showing hM3Dq-mCherry expression in the LH of a WT animal. (F) Merged image showing colocalization of c-Fos and hM3Dq-mCherry expression as indicated by white arrows. (G) Representative images of c-Fos immunoreactivity in each group. (H) CNO administration in LH::hM3Dq mice significantly increased c-Fos expression in the LH compared to controls, and c-Fos expression in the LH did not differ between Mdga1-/-mice and WT mice. n = 4 mice for each group. (I) Representative images of c-Fos immunoreactivity in each group. (J) CNO administration in LH::hM3Dq mice significantly increased c-Fos expression in the LHb compared to controls, and the Mdga1 KO was resistant to the CNO-induce activation of LHb. n = 4 mice for each group. Data are presented as the mean ± SEM. n.s., no significant difference; **p < 0.01, ***p < 0.001, ##p < 0.01, ###p < 0.001, one-way ANOVA with Tukey's multiple comparisons test for (C), two-way ANOVA with Bonferroni's multiple comparisons test for (H) and (J).
Figure 6
Figure 6
Conditional Mdga1 knockout in the LHb does not alter depressive-like behaviors but prevents CRS-induced depression onset. (A) Schematic diagram of the experimental procedure. (B) Representative images show the rAAVs injection site in the LHb. (C) Deletion of Mdga1 in the LHb did not alter immobility time of unstress mice but suppressed immobility of CRS mice in the TST. (D) Deletion of Mdga1 in the LHb did not alter immobility time of unstress mice but suppressed immobility of CRS mice in the FST. (E) Deletion of Mdga1 in the LHb did not alter sucrose preference of unstress mice but increased sucrose preference of CRS mice in the SPT. Baseline: n = 10 mice for EGFP, n = 9 mice for Cre; CRS: n = 10 mice for EGFP, n = 8 mice for Cre. Data are presented as mean ± SEM. n.s., no significant difference; *p < 0.05, **p < 0.01, two-way ANOVA with Bonferroni's multiple comparisons test.
Figure 7
Figure 7
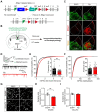
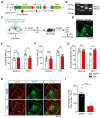
Preventing MDGA1/Nlgn2 interaction through Nlgn2 point mutation increases mIPSCs frequency and inhibitory synaptic density in the LHb. (A) Schematic diagram of Nlgn2 gene mutation. (B) PCR genotyping of genomic DNA from Nlgn2mut/mut, Nlgn2mut/+ and WT mice using forward and reverse primers (F1, R1) revealed a WT band at 290 bp and a flox-inserted band at 354 bp. (C) Sanger sequencing results confirm the Nlgn2 mutations on genomic DNA from the homozygous, heterozygous, and WT mice. (D) Immunoprecipitation results show that MDGA1 does not bind to Nlgn2 in Nlgn2mut/mut mice. (E) Schematic diagram of recording (top) and representative mIPSCs traces (bottom). (F) Nlgn2 mutant neurons exhibited a significant increase in mIPSC frequency relative to WT neurons. n = 25 neurons, from 3 mice for WT, n = 18 neurons, from 4 mice for Mutant. (G) mIPSC amplitude did not differ between the Nlgn2 mutant and WT groups. n = 25 neurons, from 3 mice for WT, n = 18 neurons, from 4 mice for Mutant. (H) Schematic diagram of recording procedures (top) and representative mIPSCs traces (bottom). (I) mEPSC frequency did not differ between the WT and Nlgn2 mutant groups. n = 10 neurons, from 3 mice for WT, n = 12 neurons, from 3 mice for Mutant. (J) mEPSC amplitude did not differ between the WT and Mutant groups. n = 10 neurons, from 3 mice for WT, n = 12 neurons, from 3 mice for Mutant. (K) Paired-pulse facilitation (PPF) was normal in the LHb of Nlgn2 mutant mice. n = 14 neurons, from 3 mice for WT group; n = 16 neurons from 3 mice for the Nlgn2 mutant group; p = 0.5712; F (1, 112) = 0.3226; two-way ANOVA. (L) Representative confocal images from LHb of WT and Nlgn2 mutant brain sections immunolabeled with inhibitory presynaptic marker GAD65 and excitatory presynaptic marker VGLUT2 are shown. (M) Quantification of punctate integrated intensity per tissue area showed a significant increase in GAD65 in LHb of Nlgn2 mutant mice. n = 5 mice for WT, n = 6 mice for Mutant. (N) Quantification of punctate integrated intensity per tissue area showed no change in VGLUT2 in the LHb of Mutant mice. n = 5 mice for WT, n = 6 mice for Mutant. Data are presented as mean ± SEM. *p < 0.05, **p < 0.01, unpaired t test.
Figure 8
Figure 8
Nlgn2mut/mut confers resistance to ARS-induced activation of LHb and the chemogenetic activation of the LH-LHb pathway. (A) Schematic diagram of the experimental procedure. (B) Representative images of c-Fos immunoreactivity in each group. (C) The density of c-Fos-positive cells in the LHb of WT animals were significantly increased after exposure to ARS when comparing naive animals, and Nlgn2mut/mut mice were resistant to the ARS-induce activation of LHb. n = 6 mice for Naive, n = 6 mice for ARS-WT, n = 6 mice for ARS-Nlgn2mut/mut. (D) Schematic diagram of the experimental procedure. (E) Representative images of c-Fos immunoreactivity in the LH of each group. (F) CNO administration in LH::hM3Dq mice significantly increased c-Fos expression in the LH compared to saline, and c-Fos expression in the LH did not differ between Nlgn2mut/mut mice and WT mice. n = 3 mice for Saline-WT, n = 4 mice for CNO-WT and Saline-Nlgn2mut/mut, n = 5 mice for CNO-Nlgn2mut/mut. (G) Representative images of c-Fos immunoreactivity in the LHb of each group. (H) CNO administration in WT LH::hM3Dq mice significantly increases c-Fos expression in the LHb compared to saline, whereas Nlgn2mut/mut mice were resistant to the CNO-induced activation of LHb. n = 3 mice for Saline-WT, n = 4 mice for CNO-WT and Saline-Nlgn2mut/mut, n = 5 mice for CNO-Nlgn2mut/mut. Data are presented as the mean ± SEM. n.s., no significant difference; *p < 0.05, **p < 0.01, ##p < 0.01, ###p < 0.001, one-way ANOVA with Tukey's multiple comparisons test for (C), two-way ANOVA with Bonferroni's multiple comparisons test for (F) and (H).
Figure 9
Figure 9
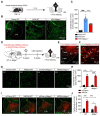
Conditional knock-in of the Nlgn2 mutation in the LHb selectively reduces chronic stress-induced depressive-like behaviors. (A) Gene targeting strategy for Nlgn2mutflox/flox mice. (B) PCR genotyping of genomic DNA from Nlgn2mutflox/flox, Nlgn2mutflox/+ and WT mice. (C) Schematic diagram of the experimental procedure is shown. (D) Representative images show the rAAV injection site in the LHb. (E) Nlgn2 mutation in the LHb did not alter immobility time of unstress mice but suppressed immobility of CRS mice in the TST. n = 7 mice for EGFP, n = 10 mice for Cre. (F) Nlgn2 mutation in the LHb does not alter immobility time of unstress mice but suppressed immobility of CRS mice in the FST. n = 7 mice for EGFP, n = 10 mice for Cre. (G) Nlgn2 mutation in the LHb did not alter sucrose preference of unstress mice but increased sucrose preference of CRS mice in the SPT. Baseline: n = 7 mice for EGFP, n = 10 mice for Cre; CRS: n = 7 mice for EGFP, n = 9 mice for Cre. (H) Representative images of c-Fos immunoreactivity in the LHb of each group. (I) Nlgn2 mutation in the LHb decreased the density of c-Fos-positive cells after ARS. n = 5 mice for EGFP, n = 5 mice for Cre. Data are presented as the mean ± SEM. n.s., no significant difference; *p < 0.05, **p < 0.01, ***p < 0.001, two-way ANOVA with Bonferroni's multiple comparisons test for (E)-(G), unpaired t test for (I).

Similar articles

References

    1. Mazure CM, Maciejewski PK. A model of risk for major depression: effects of life stress and cognitive style vary by age. Depress Anxiety. 2003;17:26–33. - PubMed
    1. Willner P, Scheel-Krüger J, Belzung C. The neurobiology of depression and antidepressant action. Neurosci Biobehav Rev. 2013;37:2331–71. - PubMed
    1. Luo J, van Grieken A, Zhou S, Fang Y, Raat H. Stressful life events, psychosocial health and general health in preschool children before age 4. World J Pediatr. 2023;19:243–50. - PMC - PubMed
    1. Berton O, Hahn CG, Thase ME. Are we getting closer to valid translational models for major depression? Science. 2012;338:75–9. - PubMed
    1. Monteggia LM, Heimer H, Nestler EJ. Meeting Report: Can We Make Animal Models of Human Mental Illness? Biol Psychiatry. 2018;84:542–5. - PMC - PubMed