. 2024 Dec 21;36(1):102442.
doi: 10.1016/j.omtn.2024.102442. eCollection 2025 Mar 11.

Glutamine missense suppressor transfer RNAs inhibit polyglutamine aggregation

Affiliations

Glutamine missense suppressor transfer RNAs inhibit polyglutamine aggregation

Rasangi Tennakoon et al. Mol Ther Nucleic Acids. .

Abstract

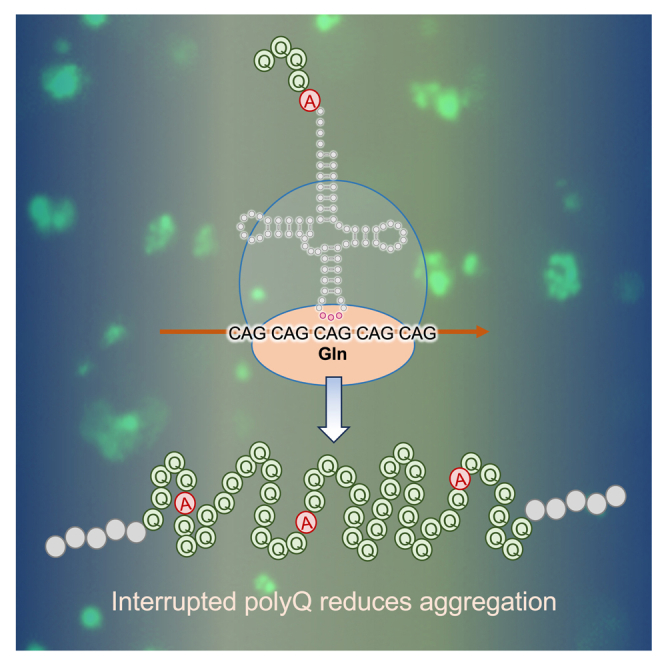
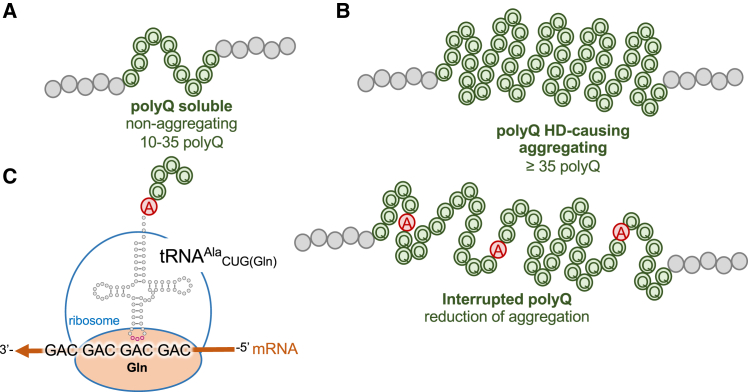
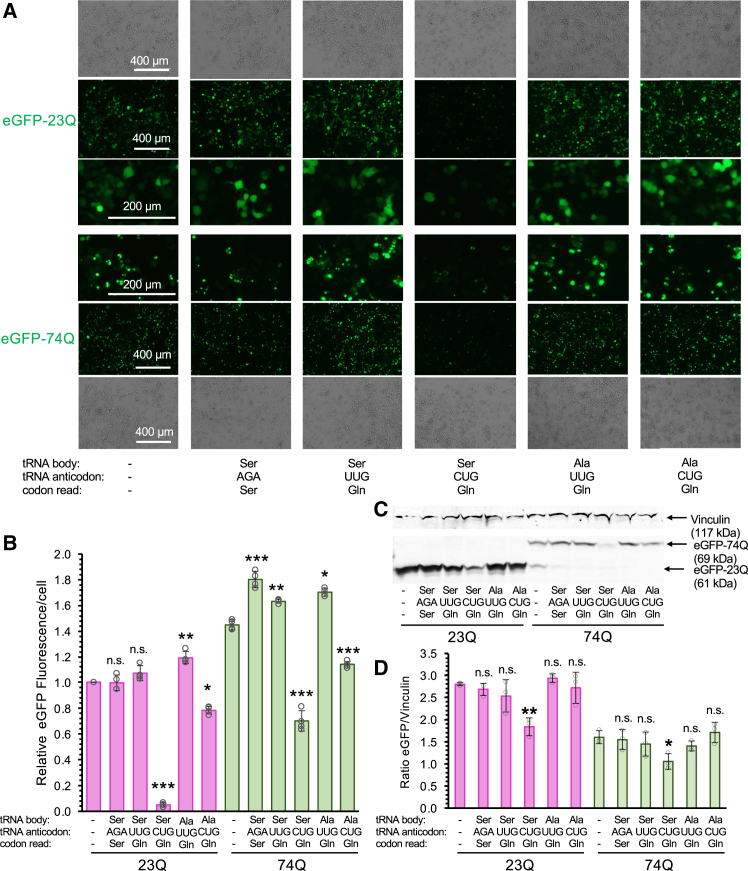
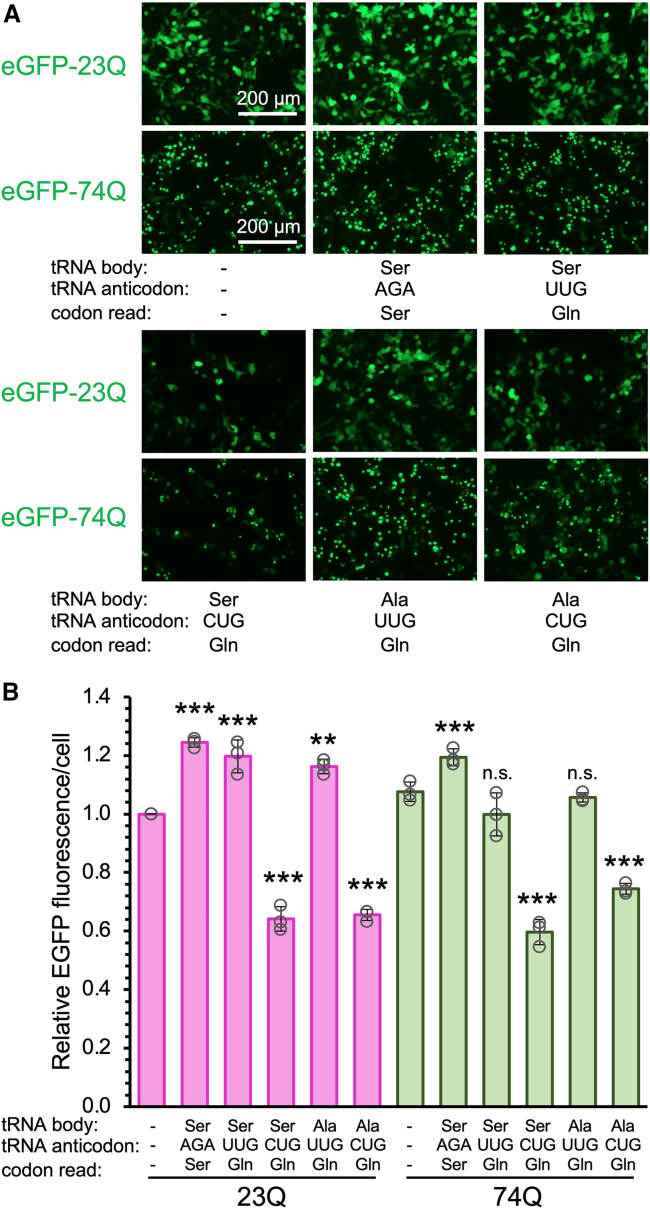
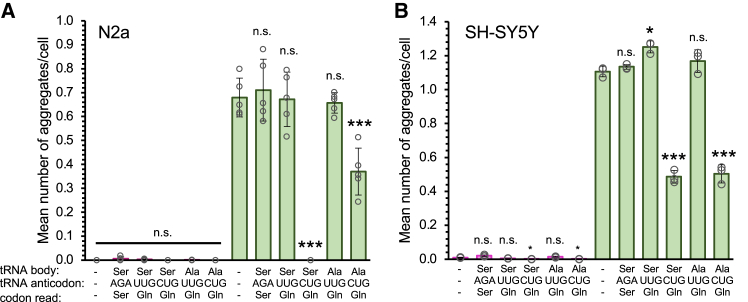
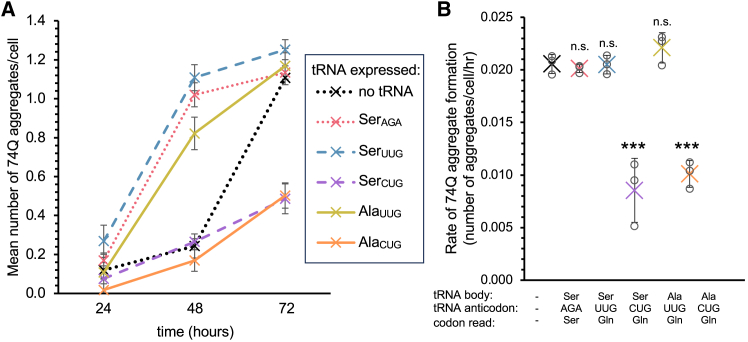
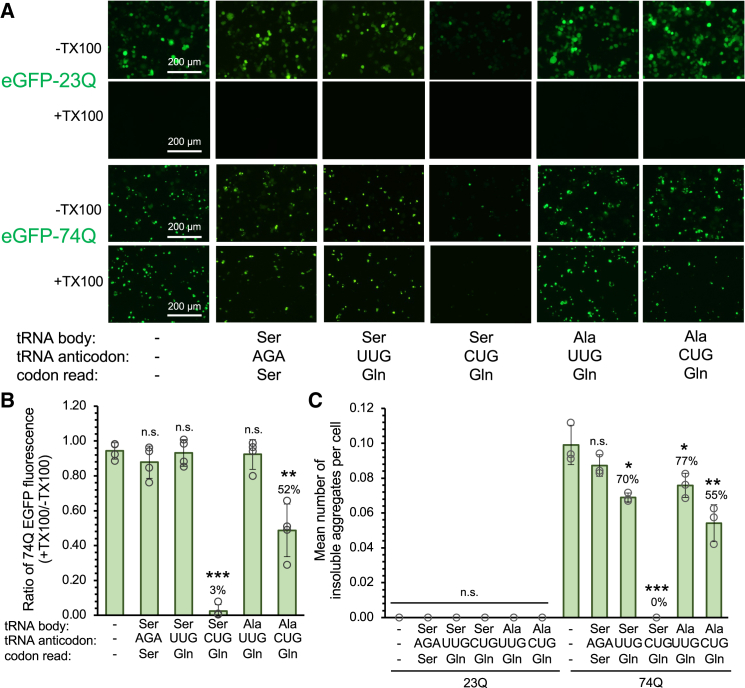
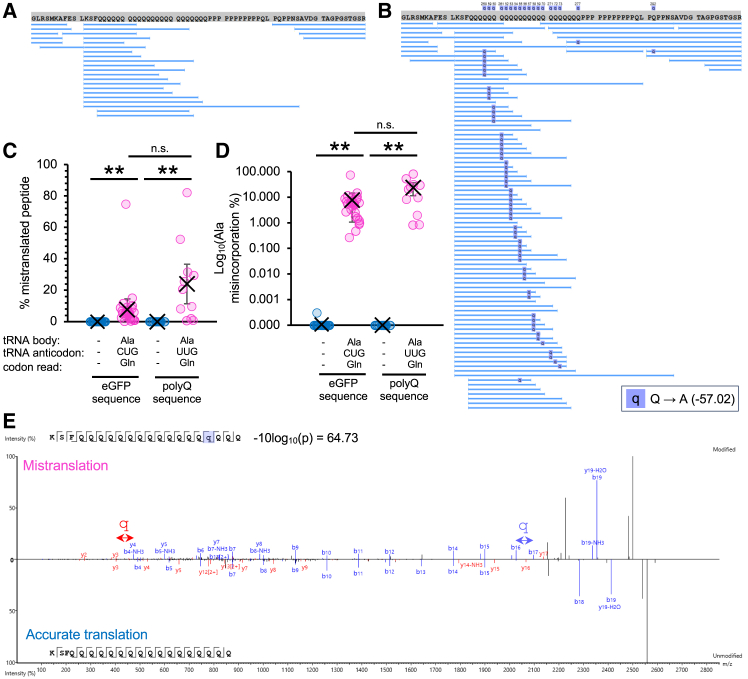
Huntington's disease (HD) is caused by polyglutamine (polyQ) repeat expansions in the huntingtin gene. HD-causative polyQ alleles lead to protein aggregation, which is a prerequisite for disease. Translation fidelity modifies protein aggregation, and several studies suggest that mutating one or two glutamine (Gln) residues in polyQ reduces aggregation. Thus, we hypothesized that missense suppression of Gln codons with other amino acids will reduce polyQ aggregate formation in cells. In neuroblastoma cells, we assessed tRNA variants that misread Gln codons with serine (tRNASer C/UUG) or alanine (tRNAAla C/UUG). The tRNAs with the CUG anticodon were more effective at suppressing the CAG repeats in polyQ, and serine and alanine mis-incorporation had differential impacts on polyQ. The expression of tRNASer CUG reduced polyQ protein production as well as both soluble and insoluble aggregate formation. In contrast, cells expressing tRNAAla CUG selectively decreased insoluble polyQ aggregate formation by 2-fold. Mass spectrometry confirmed Ala mis-incorporation at an average level of ∼20% per Gln codon. Cells expressing the missense suppressor tRNAs showed no cytotoxic effects and no defects in growth or global protein synthesis levels. Our findings demonstrate that tRNA-dependent missense suppression of Gln codons is well tolerated in mammalian cells and significantly reduces polyQ levels and aggregates that cause HD.

Keywords: HD; Huntington's disease; MT: Non-coding RNAs; gene therapy; missense suppression; mistranslation; non-coding RNA; polyQ; polyglutamine; protein aggregation; tRNA therapeutics.


Conflict of interest statement

The authors declare no conflicts of interest.

Figures

None
Graphical abstract
Figure 1
Figure 1
Mechanisms of polyQ aggregation and tRNA-dependent missense suppression of huntingtin (A) Wild-type huntingtin less than 35 glutamine repeats does not aggregate. (B) Mutant huntingtin with an expanded polyQ tract leads to protein aggregation and disease. (C) Anticodon mutations in tRNAAla cause mis-incorporation of alanine at glutamine sites in polyQ tracts.
Figure 2
Figure 2
EGFP-polyQ protein levels in wild-type and mistranslating murine neuroblastoma (N2a) cells (A) Bright-field and fluorescent images showing EGFP-polyQ production in cells co-expressing 23Q or 74Q and the indicated tRNA anticodon variants 72 h post-transfection. (B) Quantification of mean EGFP fluorescence per cell shows the level of GFP-23Q or -74Q production in individual cells. (C) Western blot and (D) quantation of the blot for EGFP with a vinculin loading control shows that the Gln-decoding tRNASer with the CUG anticodon reduces production of 23Q and 74Q, while other tRNA variants did not substantially affect total polyQ protein levels 72 h post-transfection. Error bars show ±1 standard deviation of the mean of n = 4 biological replicates. Asterisks indicate p values from independent sample t tests (n.s., no significant difference, ∗p < 0.05, ∗∗p < 0.01, and ∗∗∗p < 0.001).
Figure 3
Figure 3
GFP-polyQ levels in human neuroblastoma cells (A) Fluorescent images showing EGFP-polyQ production in cells co-expressing 23Q or 74Q and the indicated tRNA anticodon variants 72 h post-transfection in human SH-SY5Y cells. (B) Quantification of mean EGFP fluorescence per cell shows the level of GFP-23Q or -74Q production in individual cells. Error bars show ±1 standard deviation of the mean of n = 4 biological replicates. Asterisks indicate p values from independent sample t tests (n.s., no significant difference, ∗∗p < 0.01, and ∗∗∗p < 0.001).
Figure 4
Figure 4
EGFP-polyQ aggregate levels in wild-type and missense-suppressing neuroblastoma cells The average number of fluorescent polyQ aggregates per cell is plotted at 72 h post-transfection of (A) murine N2a and (B) human SH-SY5Y cells with plasmids bearing GFP-23 or -74Q and no tRNA (−) or the indicated tRNASer or tRNAAla anticodon mutant. Aggregates are identified as intensely bright foci, defined as 18 standard deviations above the mean fluorescent pixel value, and quantitated using an automated image processing algorithm, as described before. Error bars show ±1 standard deviation of the mean of (A) n = 5 or (B) n = 3 biological replicates. Asterisks indicate p values from independent sample t tests (n.s., no significant difference, ∗p < 0.05, ∗∗p < 0.01, and ∗∗∗p < 0.001).
Figure 5
Figure 5
Rate of polyQ aggregate formation in human neuroblastoma cells (A) Mean number of 74Q aggregates per cell in transfected SH-SY5Y cells at 24 h intervals and (B) the rate of 74Q aggregate formation (mean number of aggregates per cell per hour) over 72 h was calculated from the slope of each curve in (A). Error bars show ±1 standard deviation of the mean of n = 3 biological replicates. Asterisks indicate p values from independent sample t tests (n.s., no significant difference and ∗∗∗p < 0.001).
Figure 6
Figure 6
Suppression of insoluble 74Q aggregation in neuroblastoma cells N2a cells were (A) imaged 72 h after transfection with a plasmid bearing wild-type (23Q) or deleterious (74Q) huntingtin alleles and no additional tRNA, wild-type tRNASerAGA, or the Gln-decoding tRNASer or tRNAAla before and after Triton X-100 (TX100) treatment. (B) To estimate the fraction of total aggregates that are insoluble, we plotted the ratio of EGFP-74Q fluorescence from insoluble aggregates (+TX100) compared to the fluorescence prior to detergent treatment (−TX100). (C) The mean number of insoluble aggregates per cell remaining following detergent treatment was plotted. Error bars show ±1 standard deviation of the mean of at least n = 3 biological replicates. Asterisks indicate p values from independent sample t tests (n.s., no significant difference, ∗p < 0.05, ∗∗p < 0.01, and ∗∗∗p < 0.001).
Figure 7
Figure 7
Tandem mass spectrometry reveals tRNA-dependent mis-incorporation of alanine in polyQ Peptide coverage maps of tandem mass spectrometry analysis that were used to detect alanine mis-incorporation at glutamine sites in GFP-tagged HTTexon1-23Q isolated from N2a cells expressing (A) no additional tRNA or (B) tRNAAlaCUG at 72 h post-transfection. (C) For all mistranslated peptides identified, the level of missense suppression was estimated by calculating the ratio of area under the isotopic peak for the mis-incorporated a peptide (mistranslation) relative to that of a corresponding wild-type peptide (accurate translation). (D) Logarithmic plot of the percentage of mistranslated peptides relative to properly translated peptides at glutamine codons in the EGFP sequence and the polyQ tract. (E) Example mirror y and b ion spectra comparing mistranslated (top) to a corresponding properly translated peptide (bottom). Lowercase q’s in purple boxes indicate sites of alanine mis-incorporation at glutamine codons. Error bars show ±1 standard deviation of the mean of n = 3 biological replicates. Asterisks indicate p values from independent sample t tests (n.s., no significant difference and ∗∗p < 0.01).

Similar articles

Cited by

References

    1. Orr H.T., Zoghbi H.Y. Trinucleotide repeat disorders. Annu. Rev. Neurosci. 2007;30:575–621. doi: 10.1146/annurev.neuro.29.051605.113042. - DOI - PubMed
    1. Kremer B., Goldberg P., Andrew S.E., Theilmann J., Telenius H., Zeisler J., Squitieri F., Lin B., Bassett A., Almqvist E., et al. A worldwide study of the Huntington's disease mutation. The sensitivity and specificity of measuring CAG repeats. N. Engl. J. Med. 1994;330:1401–1406. doi: 10.1056/nejm199405193302001. - DOI - PubMed
    1. Genetic Modifiers of Huntington’s Disease GeM-HD Consortium Electronic address gusella@helixmghharvardedu. Genetic Modifiers of Huntington’s Disease GeM-HD Consortium CAG Repeat Not Polyglutamine Length Determines Timing of Huntington's Disease Onset. Cell. 2019;178:887–900.e14. doi: 10.1016/j.cell.2019.06.036. - DOI - PMC - PubMed
    1. Langbehn D.R., Registry Investigators of the European Huntington Disease Network Longer CAG repeat length is associated with shorter survival after disease onset in Huntington disease. Am. J. Hum. Genet. 2022;109:172–179. doi: 10.1016/j.ajhg.2021.12.002. - DOI - PMC - PubMed
    1. Wilton D.K., Stevens B. The contribution of glial cells to Huntington's disease pathogenesis. Neurobiol. Dis. 2020;143 doi: 10.1016/j.nbd.2020.104963. - DOI - PMC - PubMed

LinkOut - more resources