. 2024 Oct 28;7(2):101252.
doi: 10.1016/j.jhepr.2024.101252. eCollection 2025 Feb.

A patient-derived HCC spheroid system to model the tumor microenvironment and treatment response

Affiliations

A patient-derived HCC spheroid system to model the tumor microenvironment and treatment response

Emilie Crouchet et al. JHEP Rep. .

Abstract

Background & aims: Hepatocellular carcinoma (HCC) is the third-leading and fastest rising cause of cancer-related death worldwide. The discovery and preclinical development of compounds targeting HCC are hampered by the absence of authentic tractable systems recapitulating the heterogeneity of HCC tumors in patients and the tumor microenvironment (TME).

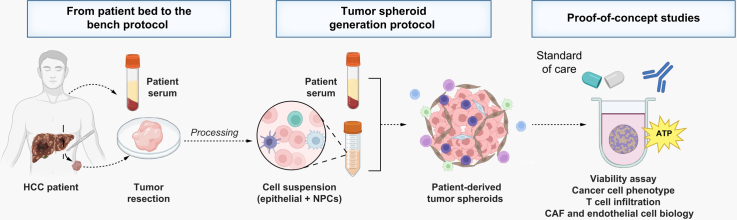
Methods: We established a novel and simple patient-derived multicellular tumor spheroid model based on clinical HCC tumor tissues, processed using enzymatic and mechanical dissociation. After quality controls, 22 HCC tissues and 17 HCC sera were selected for tumor spheroid generation and perturbation studies. Cells were grown in 3D in optimized medium in the presence of patient serum. Characterization of the tumor spheroid cell populations was performed by flow cytometry, immunohistochemistry (IHC), and functional assays. As a proof of concept, we treated patient-derived spheroids with FDA-approved anti-HCC compounds.

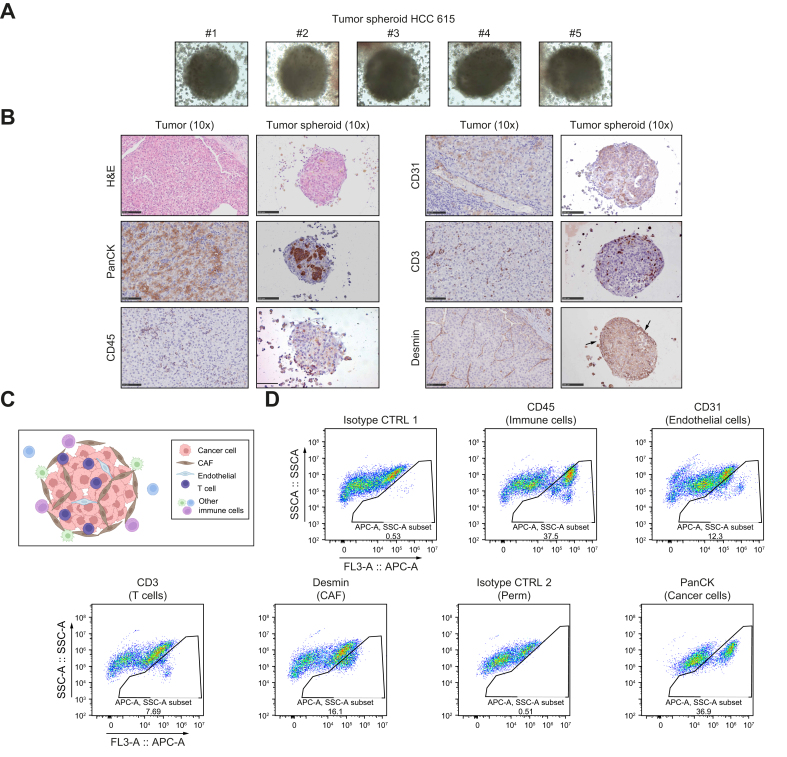
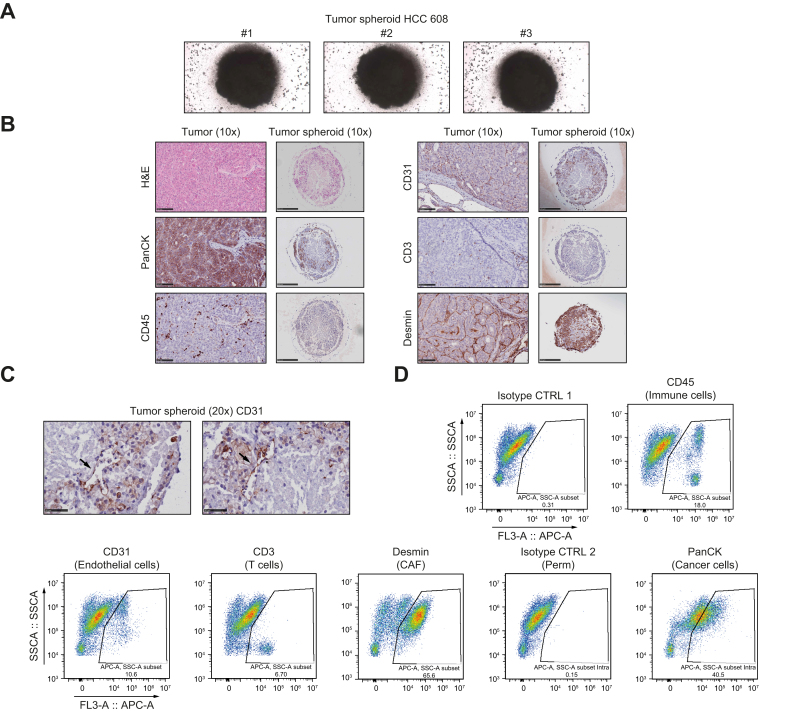
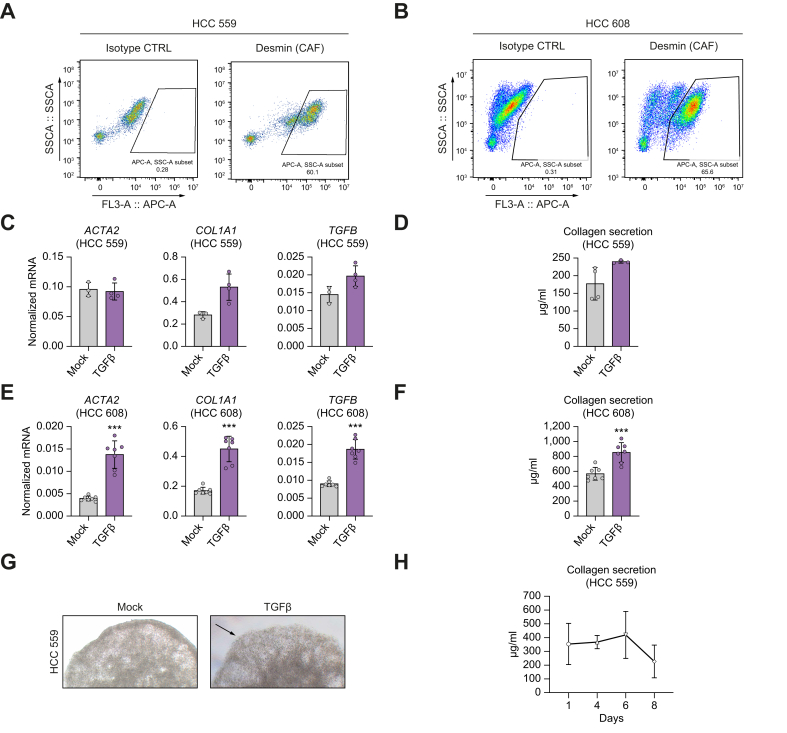
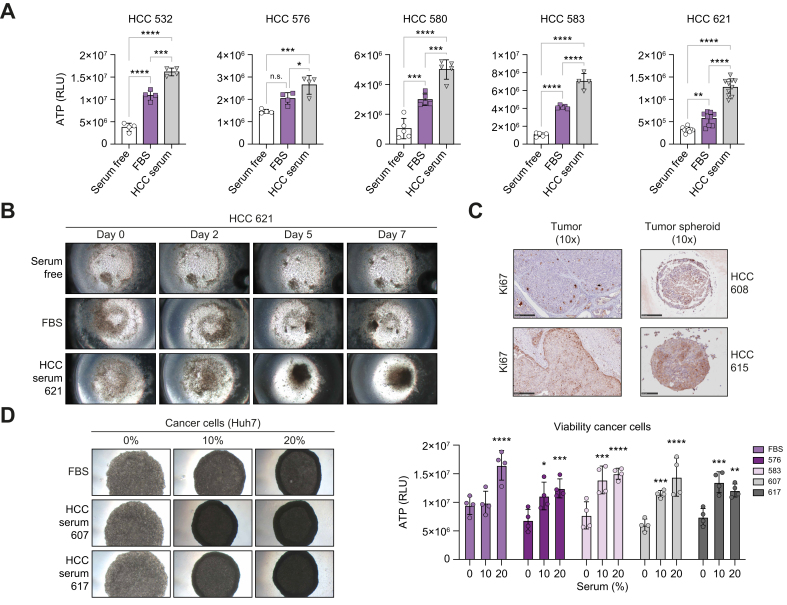
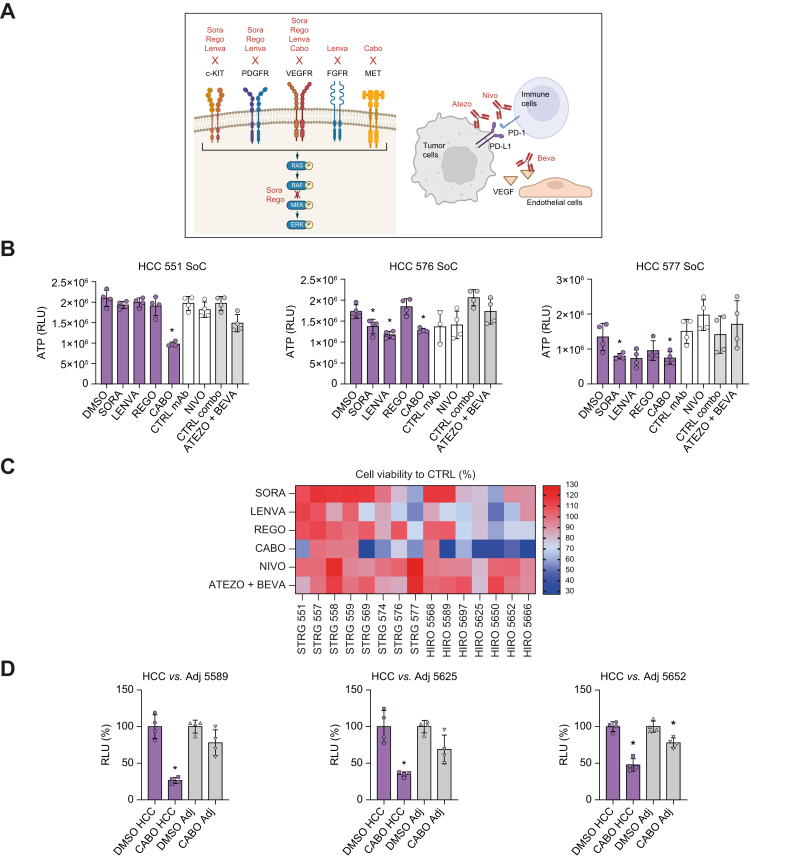
Results: The model was successfully established independently from cancer etiology and grade from 22 HCC tissues. The use of serum from patients with HCC was essential for tumor spheroid generation, TME function, and maintenance of cell viability. The tumor spheroids comprised the main cell compartments, including epithelial cancer cells, as well as all major cell populations of the TME [i.e. cancer-associated fibroblasts (CAFs), macrophages, T cells, and endothelial cells]. Tumor spheroids reflected HCC heterogeneity, including variability in cell type proportions and TME, and mimicked the original tumor features. Moreover, differential responses to FDA-approved anti-HCC drugs were observed between the donors, as observed in patients.

Conclusions: This patient HCC serum-tumor spheroid model provides novel opportunities for drug discovery and development as well as mechanism-of-action studies including compounds targeting the TME. This model will likely contribute to improve the therapeutic outcomes for patients with HCC.

Impact and implications: HCC is a leading and fast-rising cause of cancer-related death worldwide. Despite approval of novel therapies, the outcome of advanced HCC remains unsatisfactory. By developing a novel patient-derived tumor spheroid model recapitulating tumor heterogeneity and microenvironment, we provide new opportunities for HCC drug development and analysis of mechanism of action in authentic patient tissues. The application of the patient-derived tumor spheroids combined with other HCC models will likely contribute to drug development and to improve the outcome of patients with HCC.

Keywords: 3D model; Drug discovery and development; Immuno-oncology; Liver cancer; Tumor spheroids.


Conflict of interest statement

The authors declare no conflicts of interest that pertain to this work. Please refer to the accompanying ICMJE disclosure forms for further details.

Figures

Image 1
Graphical abstract
Fig. 1
Fig. 1
A simple and robust protocol to establish a patient-derived HCC tumor spheroid. (A) Experimental approach. HCC tissue and patient serum were processed to generate tumor spheroids that were used for characterization and perturbation studies. (B) Tumor spheroid formation. Aggregation of cells was observed, on average, 4 days after seeding. Cell compaction and tumor spheroid generation were observed, on average, after 7 days. Three representative examples are shown (MOTIC AE2000 Lordill, 10x). (C) Tumor spheroid viability. Viability was assessed by measurement of ATP levels and was stable at least for 7 days. Data are presented as mean ± SD (n = 4, three independent experiments). (D) Homogenous tumor spheroid formation. To show homogeneity in sphere generation, images of tumor spheroid formation for 10 tumor spheroids generated in 384-well plates is shown (MOTIC AE2000 Lordill, 10x). (A) created with BioRender (biorender.com). HCC, hepatocellular carcinoma; RLU, relative light unit.
Fig. 2
Fig. 2
Tumor spheroids contain the main HCC cell compartments and self-organize as tumor-like structures (case HCC 615). (A) Representative images of tumor spheroids in hydrogel before FFPE inclusion. Surrounding cells correspond to immune cells. Cells were imaged after 5 days of culture (MOTIC AE2000 Lordill, 10x). (B) Side-by-side H&E stainings and IHC analysis of the original tumor and corresponding tumor spheroids. Scale bars = 100 μm. (C) Model of tumor spheroid organization. (D) Analysis of different cell compartments in tumor spheroids by flow cytometry. CD45+ indicates immune cells, CD3+ indicates T cells, CD31+ indicates endothelial cells, Desmin+ indicates cancer-associated fibroblasts, and PanCK+ indicates epithelial cancer cells. (C) created with BioRender (biorender.com). FFPE, formalin-fixed paraffin-embedded; HCC, hepatocellular carcinoma; IHC, immunohistochemistry; PanCK, pan-cytokeratin.
Fig. 3
Fig. 3
Tumor spheroids contain the main HCC cell compartments and self-organize in a tumor-like structure (case HCC 608). (A) Representative images of tumor spheroids in hydrogel before FFPE inclusion. Cells were imaged after 5 days of culture (MOTIC AE2000 Lordill, 10x). (B) Side-by-side H&E stainings and IHC analysis of the original tumor and corresponding tumor spheroids. Scale bars = 100 μm. (C) High magnification of CD31 staining showed that endothelial cells organized in vessel-like structures in tumor spheroids. Scale bars = 50 μm. (D) Analysis of different cell compartments in tumor spheroids by flow cytometry. CD45+ indicate immune cells, CD3+ indicate T cells, CD31+ indicate endothelial cells, Desmin+ indicate cancer-associated fibroblasts, and PanCK+ indicate epithelial cancer cells (arrows). FFPE, formalin-fixed paraffin-embedded; HCC, hepatocellular carcinoma; PanCK, pan-cytokeratin.
Fig. 4
Fig. 4
Tumor spheroids contain functional CAFs. (A,B) Tumor spheroids from two donors, HCC 559 (A) and 608 (B), were dissociated and analyzed by flow cytometry using Desmin as a CAF marker. (C–G) Effect of TGFβ treatment on tumor spheroids. Tumor spheroids were treated with TGFβ for 24 h. (C,E) Fibrotic gene expression was analyzed by qRT-PCR. Data are presented as mean ± SD of normalized mRNA expression. HCC 559 n = 4; HCC 608 n = 7; ∗∗∗p <0.001 (two-tailed Mann-Whitney U test). (D,F). Collagen secretion was measured at day 7 by colorimetric assay in culture supernatant. Data are presented as mean ± SD of collagen secretion. HCC 559 n = 4; HCC 608 n = 8; ∗∗∗p <0.001 (two-tailed unpaired t test) (G) After TGFβ stimulation, tumor spheroids were imaged using MOTIC AE2000, Lordill (20x). (H) Collagen secretion from tumor spheroids was stable for at least 7 days. A kinetic experiment was performed without treatment using tumor spheroids. Data are presented as mean ± SD of collagen secretion (n = 3 for each day, one representative experiment out of two is shown). ACTA2, Actin alpha 2, smooth muscle; CAF, cancer-associated fibroblast; COL1A1, collagen type I alpha 1 chain; HCC, hepatocellular carcinoma.
Fig. 5
Fig. 5
Sera from patients with HCC facilitate tumor spheroid aggregation and preserve tumor spheroid viability. (A,B) Autologous sera from patients with HCC improve tumor spheroid viability. Tumor spheroids were generated from different HCC tissues without serum or in the presence of FBS or autologous serum from patients. Viability was assessed by measuring ATP levels. Data are presented as mean ± SD of ATP quantity (HCC 532, 576, and HCC 583 n = 4; HCC 580 n = 5; HCC 621, n = 10); ∗p = 0.05; ∗∗p = 0.005; ∗∗∗p = 0.0001; ∗∗∗∗p <0.0001 (one-way ANOVA followed by Tukey’s multiple comparisons test). (B) Autologous sera from patients with HCC induced tumor spheroid formation. Timeline of tumor spheroid formation is shown in serum-free conditions, and in the presence of FBS or HCC serum. Aggregation of cells was observed after 5 days only in the presence of HCC serum. Cell compaction was observed 7 days after seeding (MOTIC AE2000 Lordill, 10x). (C) IHC staining of the proliferation marker Ki67 in the original tumor and corresponding tumor spheroids in the presence of HCC serum. (D) Sera from patients with HCC improved compaction of Huh7 cell 3D culture. (Left) Huh7 spheroid culture performed in serum-free conditions, or in the presence of FBS or HCC serum from different donors at 10% or 20% (MOTIC AE2000 Lordill, 10x). (Right) Viability assessed by measurement of ATP levels (day 3). Data are presented as mean ± SD of ATP quantity (n = 4 for each condition). Serum 10% and 20% were compared with serum free for each condition; ∗p = 0.05; ∗∗p = 0.005; ∗∗∗p <0.0005, ∗∗∗∗p <0.0001 (2-way ANOVA followed by Tukey’s multiple comparisons test). HCC, hepatocellular carcinoma; IHC, immunohistochemistry; RLU, relative light unit.
Fig. 6
Fig. 6
Sera from patients with HCC preserve the TME phenotype. (A–C) Effect of sera from patients with HCC on Huh7/LX2 spheroids. (A) Spheroids from Huh7/LX2 (80-20%) cells were generated in absence of serum or increasing concentrations of FBS or sera from patients with HCC. After 72 h, tumor spheroids were imaged using MOTIC AE2000, Lordill (4x). (B) Viability was assessed by measuring ATP levels. Data are presented as mean ± SD (n = 4 for each condition); ∗p <0.05; two-tailed Mann-Whitney U test (compared with serum-free condition). (C) Stellate cell activation was assessed by measuring ACTA2 and COL1A1 expression by qRT-PCR. One representative experiment out of three is shown (see also Fig. S5). Data are presented as mean ± SD of normalized mRNA relative quantity (n = 3 for each condition). (D) Sera from patients with HCC induce macrophage differentiation in TAM-like cells. THP1-derived macrophages were incubated in presence of 10% FBS or sera from patients with HCC. After 3 days, cells were imaged using MOTIC AE2000, Lordill (20x) and macrophage phenotype was characterized by measuring different TAM markers by qRT-PCR. Data are presented as mean ± SD of normalized mRNA relative quantity (n = 4 for each condition). One representative experiment out of three is shown (see also Fig. S7); ∗p <0.05; two-tailed Mann-Whitney U test. (E,F) Sera from patients with HCC preserve the tumor spheroid TME phenotype. Tumor spheroids were cultured in presence of FBS (partial sphere formation only) and of HCC serum. Different marker expression was assessed by qRT-PCR (ACTA2 and COL1A1 for CAFs (E) and CD163 and TNFA for TAMs (F)). Data are presented as mean ± SD of normalized mRNA relative quantity (n = 5 for each condition); ∗p <0.05; two-tailed Mann-Whitney U test. (G) HCC serum prevents T cell activation in culture. CD3+ T cells were isolated from patient HCC tumors and grown in serum-free conditions (SF), in presence of FBS or of autologous sera from patients with HCC. T cell activation marker expression was assessed by qRT-PCR. Data are presented as mean ± SD of normalized mRNA relative quantity (n = 3 for each donor). Two representative experiments out of four are shown (see also Fig. S9A). ACTA2, Actin alpha 2, smooth muscle; CAF, cancer-associated fibroblast; COL1A1, collagen type I alpha 1 chain; HCC, hepatocellular carcinoma; IHC, immunohistochemistry; RLU, relative light unit; TAM, tumor-associated macrophage; TME, tumor microenvironment.
Fig. 7
Fig. 7
HCC tumor spheroids show heterogeneous responses to FDA-approved drugs. (A) Schematic of the molecular target of selected FDA-approved anti-HCC drugs. (B,C) Drug screening in tumor spheroids. Tumor spheroids were generated from tissues from 17 patients with HCC (Strasbourg and Hiroshima biobank) and treated with different FDA-approved drugs for 3 days. Viability was assessed by measurement of ATP levels. (B) Data are presented as mean ± SD of ATP quantity (n = 4) for three representative HCC tumor spheroids; ∗p <0.05, two-tailed Mann-Whitney U test (TKI vs. DMSO, mAb vs. CTRL mAb). (C) Percentage of cell viability compared with control (DMSO or CTRL mAbs); n = 4 for 15 HCC tumor spheroids. (D) Anti-HCC drug response is higher in HCC tumor spheroids compared with spheroids generated from adjacent nontumoral tissues. Data are presented as mean ± SD of percentage of cell viability vs. respective controls (n = 4, three independent experiments); ∗p <0.05, two-tailed Mann-Whitney U test (Cabo vs. DMSO). (A) Created with BioRender (biorender.com). Atezo, atezolizumab; Beva, bevacizumab; Cabo, cabozantinib; CTRL, control; HCC, hepatocellular carcinoma; Lenva, lenvatinib; mAb, monoclonal antibody; Nivo, nivolumab; Rego, regorafenib; SoC, standard of care; Sora, sorafenib.
Fig. 8
Fig. 8
HCC tumor spheroids respond to immunotherapy. (A,B) Tumor spheroids from HCC 569 and HCC 580 were treated with nivolumab or CTRL mAb for 6 days. At day 6, they were dissociated and analyzed by flow cytometry. Gating shows selection of a specific CD3+ T cell population among total cells. PD-1 was detected as a T cell exhaustion marker targeted by nivolumab. (C) Tumor spheroids from HCC 600 and 608 were treated with standard-of-care combination therapy comprising atezolizumab and bevacizumab for 6 days. VEGF levels were measured in culture supernatants by ELISA assay. Data are presented as mean ± SD of VEGF quantity; ∗∗∗p <0.0005; ∗∗∗∗p <0.0001 (two tailed unpaired t test). CTRL, control; HCC, hepatocellular carcinoma; mAb, monoclonal antibody; VEGF, vascular endothelial growth factor.

Similar articles

References

    1. Vogel A, Meyer T, Sapisochin G, et al. Hepatocellular carcinoma. Lancet. 2022;400:1345–1362. - PubMed
    1. Huang DQ, El-Serag HB, Loomba R. Global epidemiology of NAFLD-related HCC: trends, predictions, risk factors and prevention. Nat Rev Gastroenterol Hepatol. 2021;18:223–238. - PMC - PubMed
    1. Ducreux M., Abou-Alfa G.K., Bekaii-Saab T., et al. The management of hepatocellular carcinoma. Current expert opinion and recommendations derived from the 24th ESMO/World Congress on Gastrointestinal Cancer, Barcelona, 2022. ESMO Open. 2023;8 - PMC - PubMed
    1. Yang C., Zhang H., Zhang L., et al. Evolving therapeutic landscape of advanced hepatocellular carcinoma. Nat Rev Gastroenterol Hepatol. 2023;20:203–222. - PubMed
    1. Barcena-Varela M., Lujambio A. The endless sources of hepatocellular carcinoma heterogeneity. Cancers. 2021;13:2621. - PMC - PubMed

LinkOut - more resources