. 2025;6(1):75.
doi: 10.1038/s43247-025-02051-4. Epub 2025 Feb 1.

Global decline in net primary production underestimated by climate models

Affiliations

Global decline in net primary production underestimated by climate models

Thomas J Ryan-Keogh et al. Commun Earth Environ. 2025.

Abstract

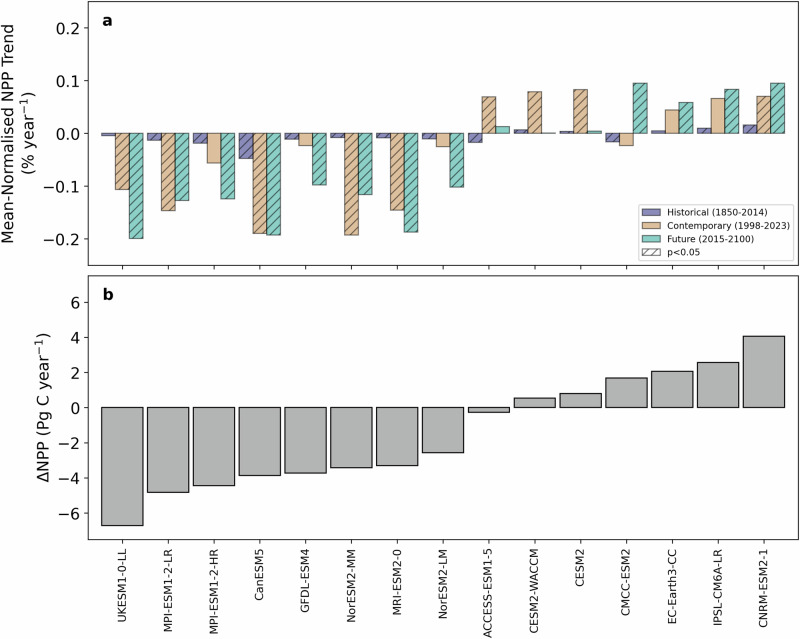
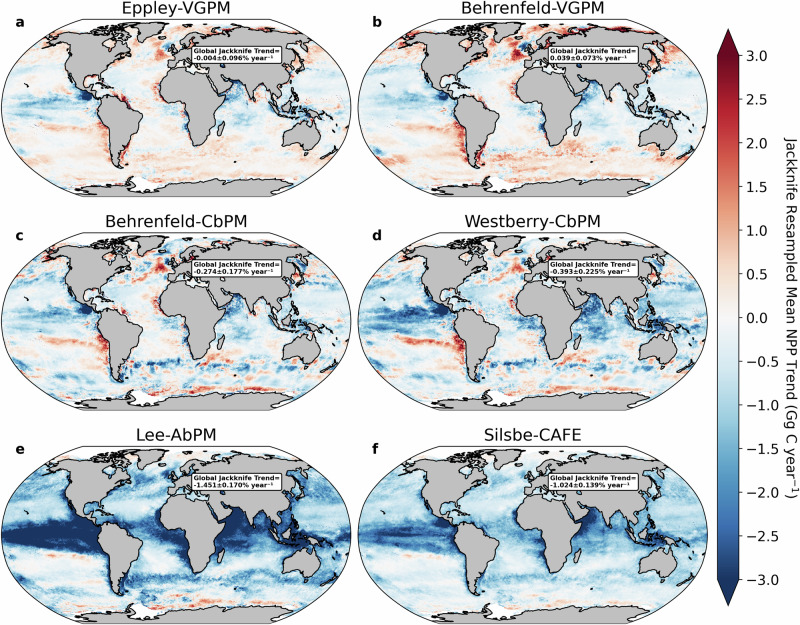
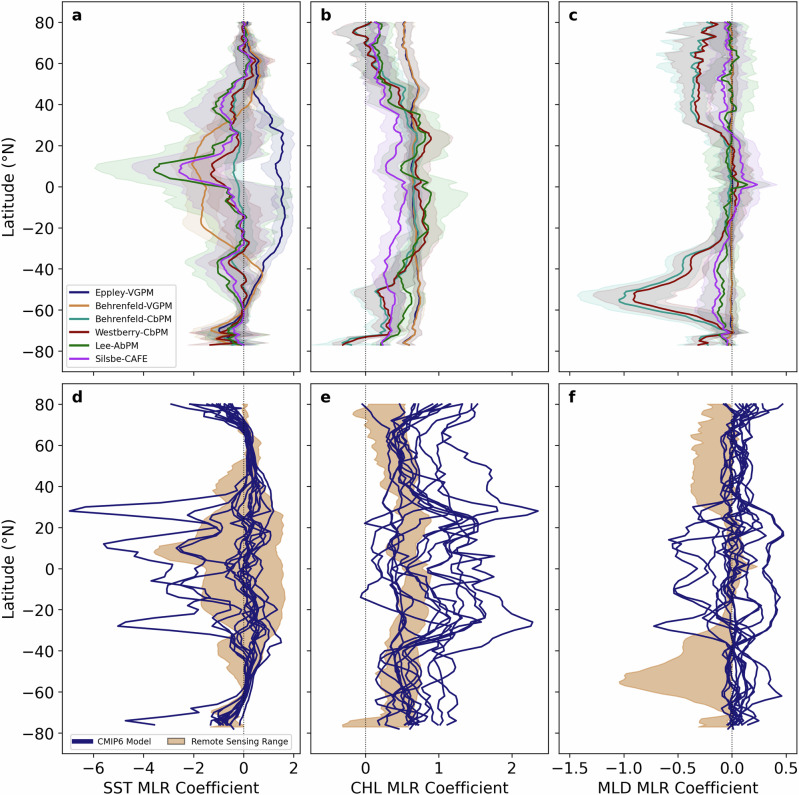
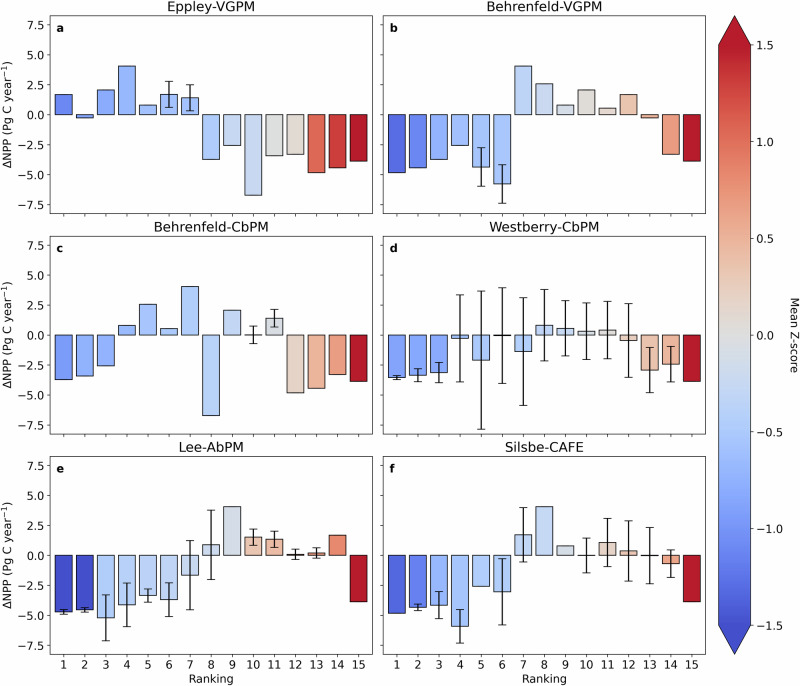
Marine net primary production supports critical ecosystem services and the carbon cycle. However, the lack of consensus in the direction and magnitude of projected change in net primary production from models undermines efforts to assess climate impacts on marine ecosystems with confidence. Here we use contemporary remote sensing net primary production trends (1998-2023) from six remote sensing algorithms to discriminate amongst fifteen divergent model projections. A model ranking scheme, based on the similarity of linear responses of net primary production to changes in sea surface temperature, chlorophyll-a and the mixed layer, finds that future declines in net primary production are more likely than presently predicted. Even the best ranking models still underestimate the sensitivity of declines in net primary production to ocean warming, suggesting shortcomings remain. Reproducing this greater temperature sensitivity may lead to even larger declines in future net primary production than presently considered for impact assessment.

Keywords: Marine biology.


Conflict of interest statement

Competing interestsThe authors declare no competing interests.

Figures

Fig. 1
Fig. 1. Variability of net primary production trends from CMIP6 Earth system models.
a Area-weighted mean-normalised net primary production (NPP) annual trends (% year−1) calculated using ordinary least squares for the historical (1850–2014), contemporary (1998–2023) and future (2015–2100) periods for the CMIP6 Earth system model ensemble. b Area-weighted ΔNPP (Pg C year−1), calculated as the difference between the end of the historical period (1995–2014) and the end of the century (2081–2100), for each of the Earth system models in the CMIP6 ensemble. Both panels are sorted by ΔNPP from low to high values.
Fig. 2
Fig. 2. Comparing jackknife resampled trends of net primary production from different remote sensing algorithms.
Global distribution of the mean jackknife resampled trends (1998–2023) of annual mean net primary production (NPP; Gg C year−1) from a Eppley-VGPM, b Behrenfeld-VGPM, c Behrenfeld-CbPM, d Westberry-CbPM, e Lee-AbPM and f Silsbe-CAFE. Inset text reports the area weighted mean ±1σ jackknife resampled (80% of the 26-year time series) NPP trend (% year−1) as displayed in Supplementary Fig. S1b.
Fig. 3
Fig. 3. Comparing the spatial variability of the dominant multiple linear regression coefficients between remote sensing and Earth system models.
Zonal averages ± standard deviations of the multiple linear regression coefficients for a, d sea surface temperature (SST), b, e chlorophyll-a concentrations (CHL) and c, f mixed layer depth (MLD) for the ac Eppley-VGPM, Behrenfeld-VGPM, Behrenfeld-CbPM, Westberry-CbPM, Lee-AbPM and Silsbe-CAFE NPP algorithms and df the ensemble of CMIP6 Earth system models. Only pixels/grid points where the multiple linear regression analysis was significant are included in the zonal averages. The shaded region in panels df represents the range of coefficients as estimated from the remote sensing algorithms zonal averages (panels ac).
Fig. 4
Fig. 4. Ranking Earth system models using Z-score assessments of the Earth mover's distance metric.
Bar plots of mean ± standard deviation jackknife resampled ranked Earth system model ΔNPP (Pg C year−1) for a Eppley-VGPM, b Behrenfeld-VGPM, c Behrenfeld-CbPM, d Westberry-CbPM, e Lee-AbPM and f Silsbe-CAFE NPP algorithms. All bars are coloured by the mean Z-score across the jackknife resampling exercise. Please note that the absence of an errorbar is indicative of the same model being ranked in the same position for all 7 of the jackknife assessments.

References

    1. Bindoff, N. L. et al. Changing Ocean, Marine Ecosystems, and Dependent Communities. In IPCC Special Report on the Ocean and Cryosphere in a Changing Climate (eds. Pörtner, H.-O. et al.) 477–587 (Intergovernmental Panel on Climate Change, 2019).
    1. IPCC. Climate Change 2021: The Physical Science Basis. Contribution of Working Group I to the Sixth Assessment Report of the Intergovernmental Panel on Climate Change. (Cambridge University Press, Cambridge, United Kingdom and New York, USA, 2021).
    1. Tagliabue, A. et al. Persistent Uncertainties in Ocean Net Primary Production Climate Change Projections at Regional Scales Raise Challenges for Assessing Impacts on Ecosystem Services. Front. Clim.3, 10.3389/fclim.2021.738224 (2021).
    1. Kwiatkowski, L. et al. Twenty-first century ocean warming, acidification, deoxygenation, and upper-ocean nutrient and primary production decline from CMIP6 model projections. Biogeosciences17, 3439–3470 (2020). - DOI
    1. Lotze, H. K. et al. Global ensemble projections reveal trophic amplification of ocean biomass declines with climate change. Proc. Natl. Acad. Sci.116, 12907–12912 (2019). - DOI - PMC - PubMed

LinkOut - more resources