. 2024 Dec;74(5):403-414.
doi: 10.1270/jsbbs.24028. Epub 2024 Nov 23.

Polyploid QTL-seq identified QTLs controlling potato flesh color and tuber starch phosphorus content in a plexity-dependent manner

Affiliations

Polyploid QTL-seq identified QTLs controlling potato flesh color and tuber starch phosphorus content in a plexity-dependent manner

Hiromoto Yamakawa et al. Breed Sci. 2024 Dec.

Abstract

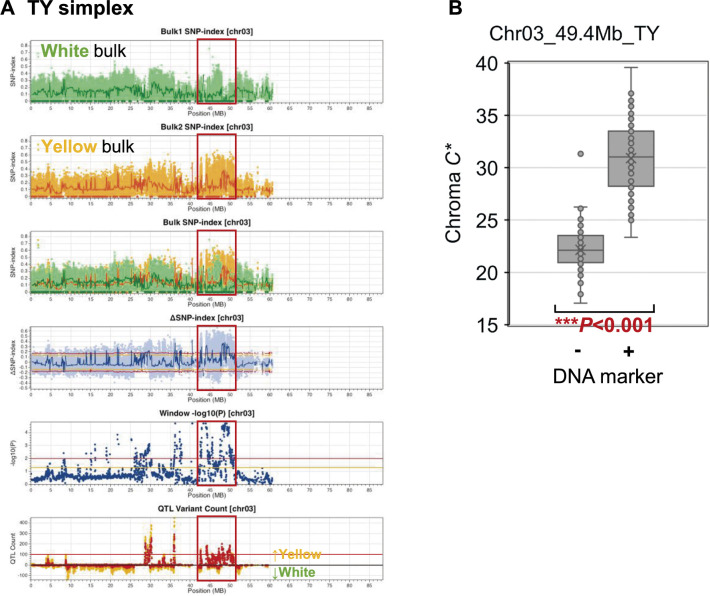
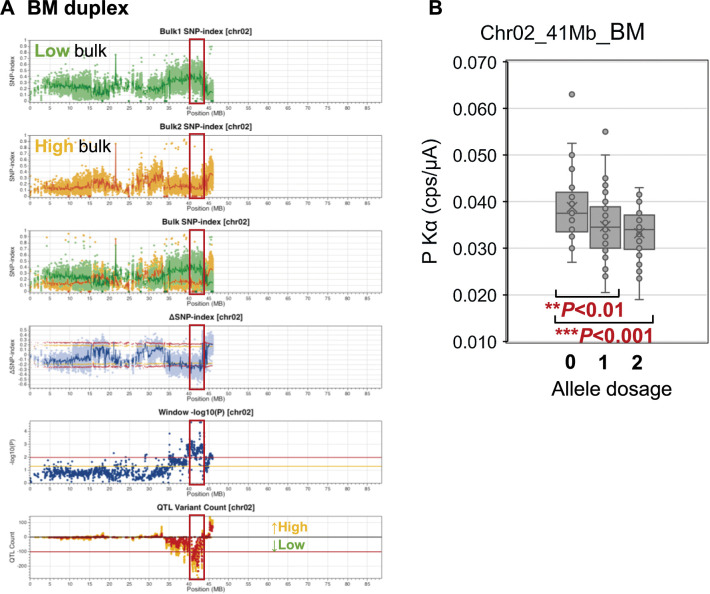
The progenies of polyploid crops inherit multiple sets of homoeologous chromosomes through various combinations, which impedes the identification of the quantitative trait loci (QTL) governing agronomic traits and the implementation of DNA marker-assisted breeding. Previously, we developed a whole-genome sequencing-based polyploid QTL-seq method that utilizes comprehensively extracted simplex polymorphisms for QTL mapping. Here, we verified the detection of duplex QTLs by modifying the analytical settings to explore the QTLs governing tuber flesh color and starch phosphorus content using tetraploid potato (Solanum tuberosum L.). The F1 progenies were obtained from a cross between 'Touya' (TY) and 'Benimaru' (BM). A single TY-derived QTL responsible for yellow flesh color was identified around a β-carotene hydroxylase gene on chromosome 3 using simplex polymorphisms, and a BM-derived QTL associated with decreased starch phosphorus content near a starch synthase II gene on chromosome 2 was detected using duplex polymorphisms. Furthermore, linked DNA markers were developed at the QTL sites. For the latter QTL, plexity-distinguishable markers were developed using quantitative PCR, fragment analysis, and amplicon sequencing. These revealed the allele dosage-dependent effect of the reduced starch phosphorus content. Thus, the polyploid QTL-seq pipeline can explore versatile QTLs beyond simplex, facilitating DNA marker-assisted breeding in various polyploid crops.

Keywords: DNA marker; QTL-seq; flesh color; plexity; polyploid; potato; starch phosphorus content.


Figures

Fig. 1.
Fig. 1.
Appearance of cut surfaces of tubers and distribution of flesh color for ‘Benimaru’ (BM), ‘Touya’ (TY), and F1 progenies. (A) Surface appearance of tuber sections. (B) The number of F1 lines with specific chroma C* values determined by a color reader showing the averages for tests conducted in 2022 and 2023. Red arrowheads highlight the values of 17.78 for BM and 30.93 for TY. Green and orange represent the criteria for defining white and yellow bulks for QTL-seq analysis, respectively.
Fig. 2.
Fig. 2.
The genomic region associated with yellow flesh color in F1 progenies. (A) Polyploid QTL-seq analysis employing TY-derived simplex variants. SNP-index plots of the white and yellow bulk, their superimposed plot, ΔSNP-index plot, window –log10P plot, and QTL variant count plot are depicted. Dark green and orange dots in the SNP-index plots denote variants with an SNP-index of 0. Green, red, and blue lines represent the sliding window average of a 100 kb interval with a 20 kb increment for SNP-index and ΔSNP-index. The window –log10P plot displays the average of the –log10P values of all variants within the sliding window. Orange and red lines on the ΔSNP-index plot and the window –log10P plot represent 95% and 99% statistical confidence thresholds under the null hypothesis of no QTLs, respectively. The QTL variant count plot illustrates the number of QTL-deduced variants in the sliding window. Orange and red dots on the QTL variant count plot indicate the number of variants deduced as QTL with 95% and 99% statistical confidence, respectively, while red lines signify the threshold of 100 for determining the QTL candidates. Variants are categorized based on the direction of QTL effects, with those exhibiting positive and negative ΔSNP-index values plotted upward and downward, respectively, on the QTL variant count plot. A candidate region identified as QTL is delineated by red frames. The graphs are depicted for Chr03 in the TY-derived simplex analysis. Additional chromosomes and those for the analyses with duplex variants are presented in Supplemental Fig. 2. (B) Genotyping using a developed DNA marker. Assessment of a flesh color-associated SNP marker derived from the TY simplex variant (Chr03_49.4Mb_TY) was conducted. The association between the marker genotype (+; presence or –; absence) and flesh color chroma C* in the F1 population (n = 169) is depicted. The box plots illustrate the minimum, first quartile, median, third quartile, and maximum values, with the “x” marks representing the mean values. Significant differences are denoted by asterisks (Student’s t-test, ***P < 0.001). Amplification using control GBSS primers was validated.
Fig. 3.
Fig. 3.
Tuber starch phosphorus content of BM, TY, and F1 progenies. The number of F1 lines with specific P Kα count determined by energy-dispersive X-ray fluorescence spectroscopy and the averages for tests conducted in 2022 and 2023 are presented. Red arrowheads indicate the values of 0.0215 cps/μA for BM and 0.0545 cps/μA for TY, along with the phosphorus contents determined by inductively coupled plasma-optical emission spectrometry, 31.3 and 73.0 mg/100 g, respectively. Criteria for low and high bulks for QTL-seq analysis are denoted in green and orange, respectively.
Fig. 4.
Fig. 4.
The genomic region associated with starch phosphorus content in F1 progenies. (A) Polyploid QTL-seq analysis using BM-derived duplex variants. Plots consisting of the SNP-index of low bulk and high bulk, their superimposition, ΔSNP-index, window –log10P, and QTL variant counts are depicted, as shown in Fig. 2. Red frames indicate candidate regions deduced as QTLs. The graphs are depicted for Chr02 in the BM-derived duplex analysis. Additional chromosomes and those for the analyses with simplex variants are presented in Supplemental Fig. 4. (B) Genotyping using developed DNA markers. Evaluation of phosphorus content-linked SNP markers from the BM duplex variants (Chr02_41Mb_BM). The relationship between the allele dosage (0; nulliplex, 1; simplex, and 2; duplex) and the P Kα value is shown for the F1 population (n = 171). The box plots illustrate the minimum, first quartile, median, third quartile, and maximum values, with the “x” marks representing the mean values. Asterisks denote significant differences (**P < 0.01, ***P < 0.001), as examined by ANOVA.

References

    1. Aalborg, T., Sverrisdóttir E., Kristensen H.T. and Nielsen K.L. (2024) The effect of marker types and density on genomic prediction and GWAS of key performance traits in tetraploid potato. Front Plant Sci 15: 1340189. - PMC - PubMed
    1. Asano, K., Kobayashi A., Tsuda S., Nishinaka M. and Tamiya S. (2012) DNA marker-assisted evaluation of potato genotypes for potential resistance to potato cyst nematode pathotypes not yet invading into Japan. Breed Sci 62: 142–150. - PMC - PubMed
    1. Asano, K. and Tamiya S. (2016) Breeding of pest and disease resistant potato cultivars in Japan by using classical and molecular approaches. Jpn Agric Res Q 50: 1–6.
    1. Asano, K., Shimosaka E., Yamashita Y., Narabu T., Aiba S., Sakata I., Akai K., Okamoto S. and Tamiya S. (2021) Improvement of diagnostic markers for resistance to Globodera pallida and application for selection of resistant germplasms in potato breeding. Breed Sci 71: 354–364. - PMC - PubMed
    1. Asano, K. and Endelman J.B. (2024) Development of KASP markers for the potato virus Y resistance gene Rychc using whole-genome resequencing data. Am J Potato Res 101: 114–121.