. 2025 Jan 17:18:1441280.
doi: 10.3389/fncir.2024.1441280. eCollection 2024.

Hyaluronidase-induced matrix remodeling contributes to long-term synaptic changes

Affiliations

Hyaluronidase-induced matrix remodeling contributes to long-term synaptic changes

Rostislav Sokolov et al. Front Neural Circuits. .

Abstract

Extracellular brain space contains water, dissolved ions, and multiple other signaling molecules. The neural extracellular matrix (ECM) is also a significant component of the extracellular space. The ECM is synthesized by neurons, astrocytes, and other types of cells. Hyaluronan, a hyaluronic acid polymer, is a key component of the ECM. The functions of hyaluronan include barrier functions and signaling. In this article, we investigate physiological processes during the acute phase of enzymatic ECM removal. We found that hyaluronidase, an ECM removal agent, triggers simultaneous membrane depolarization and sharp calcium influx into neurons. Spontaneous action potential firing frequency increased rapidly after ECM destruction in interneurons, but not pyramidal neurons. Hyaluronidase-dependent calcium entry can be blocked by a selective antagonist of N-methyl-D-aspartate (NMDA) receptors, revealing these receptors as the main player in the observed phenomenon. Additionally, we demonstrate increased NMDA-dependent long-term potentiation at CA3-to-CA1 synapses during the acute phase of ECM removal. These findings suggest that hyaluronan is a significant synaptic player.

Keywords: NMDA receptors; extracellular matrix; hippocampus; hyaluronidase; synaptic plasticity.


Conflict of interest statement

The authors declare that the research was conducted in the absence of any commercial or financial relationships that could be construed as a potential conflict of interest. The author(s) declared that they were an editorial board member of Frontiers, at the time of submission. This had no impact on the peer review process and the final decision.

Figures
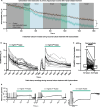
Figure 1
Figure 1
Physiological effects of rapid ECM partial solubilization with hyaluronidase in primary hippocampal cultures. (A) WFA-Alexa594 live-stained cells and Hyase applications. The first group (black color on graph, n = 9 from 3 different cultures)—a control group with pure solution application. The second group (vermillion color on graph n = 16 from three different cultures)—heat-inactivated Hyase. The third group (green color on graph n = 10 from three different cultures)—active hyaluronidase. Graph colors: gray—control acquisition without washing, green—acquisition without washing with the presence of Hyase, blue—washing out with 25 mL of solution. The first hyaluronidase washout contributes to the reduction of the signal from WFA. Two-way ANOVA [F (358, 5,760) = 2.889 p < 0.0001] with Dunnett’s post-hoc analysis showed significant differences between control and Hyase for points starting from 550 s (550 s, p = 0.0385, 1800 s, p < 0.0001). The detailed methodology is described in supplementary information. (B) Representative traces of neuronal soma GCaMP6f fluorescence with an increased fluorescence during the first and second applications of Hyase for 2 min (green line shows the application of 0.1 mg/mL Hyase). Black line is averaged trace of all cells from one culture. (C) GCaMP6f normalized peak amplitudes of the first and second applications of Hyase. Paired comparison of the first and second applications of Hyase by paired t-test, four cultures, 128 neurons. Peak amplitude: Hyase1 = 787.2 ± 47.6% vs. Hyase2 = 573.8 ± 30.8%, p < 0.0001. (D) Current clamp recordings of membrane potential during the first and second 2-min Hyase applications. Average depolarization during the first application of Hyase was 48.0 ± 4.4 mV, n = 13 neurons. (E) Voltage clamp recording of membrane current during Hyase application. Hyase concentration specified on graph.
Figure 2
Figure 2
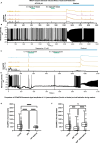
Spontaneous firing and action potential phase portrait of cultured interneurons changes after Hyase treatment. (A,B) Representative recordings of firing patterns of cultured fast-spiking interneurons and pyramidal neurons. Action potentials evoked by the depolarization of neuronal membrane with current injections. (C,D) Representative traces of spontaneous firing before and after Hyase treatment of fast-spiking and pyramidal neurons. Green line shows the application of Hyase in the recording chamber (around 2 min). Membrane depolarization ascent during Hyase application (FSI 52.7 ± 3.9 mV vs. Pyr 40.5 ± 9.3 mV, p = 0.1893, ns) (E,F) Phase portraits of spontaneous action potentials before and after Hyase treatment of fast-spiking and pyramidal neurons. Black and green action potentials and phase portraits represent averages before and after Hyase treatment, respectively. (G,H) Changes of spontaneous firing frequency after Hyase treatment of fast-spiking and pyramidal neurons. Calculations were performed for the 10 min before and 10 min after Hyase applications (FSI 1.44 ± 0.44 vs. 3.19 ± 0.52 Hz, p < 0.0198, n = 8; Pyr 0.22 ± 0.043 vs. 0.88 ± 0.46 Hz, p = 0.2187, n = 5). Hyase concentrations are specified on the graph.
Figure 3
Figure 3
NMDARs blockade prior to rapid ECM digestion by Hyase leads to the disappearance of the prolonged calcium influx and decreases the prolonged membrane potential ascent. Different colors show the signal of GCamp6f from different spontaneously active cells. The patched cell is marked in black color. (A) Simultaneous recording of calcium signal and (B) membrane potential signal before APV treatment, during two Hyase applications (2 min), and after washout of APV, n = 3 cultures. (C) Simultaneous recording of calcium signal and (D) membrane potential signal before increase of magnesium 10 mM in recording chamber solution, during two Hyase applications (2 min), and after washout with normal magnesium concentration (1.5 mM), n = 3 cultures. (E) Two-way ANOVA with Tukey post-hoc. Groups consisted of four control cultures (208 cells) vs. 3 APV cultures (64 cells). (Control vs. APV: 597.9 ± 26.7 vs. 5.1 ± 0.8, p < 0.0001; APV vs. Washout: 5.1 ± 0.8 vs. 455.9 ± 21.86, p < 0.0001). (F) Two-way ANOVA with Tukey post-hoc. Groups consisted of four control cultures (208 cells) vs. three Mg2+ 10 mM cultures (33 cells). (Control vs. Mg2+ 10 mM: 597.9 ± 26.7 vs. 383.7 ± 75.6, p < 0.0001; Mg2+ 10 mM vs. washout: 383.7 ± 75.6 vs. 868.9 ± 104.1, p < 0.0001). Hyase concentrations are specified on the graph.
Figure 4
Figure 4
Hyase treatment leads to ECM attenuation and facilitation of synaptic plasticity. (A) Confocal images of ECM in acute brain slices labeled with WFA. Left—intact ECM; right—ECM after 60 min of Hyase presence. Scale bar: 100 um. (B) Hippocampal whole-cell LTP, paired (open squares) and control inputs (filled squares). Left (black)—Sham hippocampal slices. Middle (green)—10 min preincubation in Hyase. Right (blue)—60 min preincubation in Hyase. (C) Normalized potentiation of paired inputs. Groups specified by color. The time window of significantly different time points (two-way ANOVA with Dunnett’s post-hoc analysis) for 10 min incubated slices were from 9th to 40th min after LTP induction. Significantly different timepoints are marked with asterisks. Three significantly different timepoints for 60 min incubated slices marked with asterisks. The n-cells were: control n = 7, 10 min Hyase-treated n = 7, 60 min Hyase-treated n = 5. (D) Hippocampal whole-cell EPSCs (n = 5), recorded in presence of SR95531, CNQX, and EDTA. Black color shows control EPSCs and green color increasing of EPSCs after Hyase treatment. APV was added to confirm the NMDAR nature of recorded EPSCs. Normalized EPSCs: Control 0.9985 ± 0.0168 vs. Hyase 1.602 ± 0.0359. Unpaired t-test, p < 0.0002. Hyase concentration 0.14 mg/mL (for details, see the Materials and Methods section).

Similar articles

Cited by

References

    1. Amin S., Borrell V. (2020). The extracellular matrix in the evolution of cortical development and folding. Front. Cell Dev. Biol. 8:604448. doi: 10.3389/fcell.2020.604448, PMID: - DOI - PMC - PubMed
    1. Arranz A. M., Perkins K. L., Irie F., Lewis D. P., Hrabe J., Xiao F., et al. . (2014). Hyaluronan deficiency due to Has3 knock-out causes altered neuronal activity and seizures via reduction in brain extracellular space. J. Neurosci. 34, 6164–6176. doi: 10.1523/JNEUROSCI.3458-13.2014, PMID: - DOI - PMC - PubMed
    1. Balashova A., Pershin V., Zaborskaya O., Tkachenko N., Mironov A., Guryev E., et al. . (2019). Enzymatic digestion of Hyaluronan-based brain extracellular matrix in vivo can induce seizures in neonatal mice. Front. Neurosci. 13:1033. doi: 10.3389/fnins.2019.01033, PMID: - DOI - PMC - PubMed
    1. Bikbaev A., Frischknecht R., Heine M. (2015). Brain extracellular matrix retains connectivity in neuronal networks. Sci. Rep. 5:14527. doi: 10.1038/srep14527, PMID: - DOI - PMC - PubMed
    1. Brakebusch C., Seidenbecher C. I., Asztely F., Rauch U., Matthies H., Meyer H., et al. . (2002). Brevican-deficient mice display impaired hippocampal CA1 long-term potentiation but show no obvious deficits in learning and memory. Mol. Cell. Biol. 22, 7417–7427. doi: 10.1128/MCB.22.21.7417-7427.2002, PMID: - DOI - PMC - PubMed

MeSH terms

LinkOut - more resources