. 2025 Jan 10;11(2):e41865.
doi: 10.1016/j.heliyon.2025.e41865. eCollection 2025 Jan 30.

Identification and validation of depression-associated genetic variants in the UK Biobank cohort with transcriptome and DNA methylation analyses in independent cohorts

Affiliations

Identification and validation of depression-associated genetic variants in the UK Biobank cohort with transcriptome and DNA methylation analyses in independent cohorts

Muataz S Lafta et al. Heliyon. .

Abstract

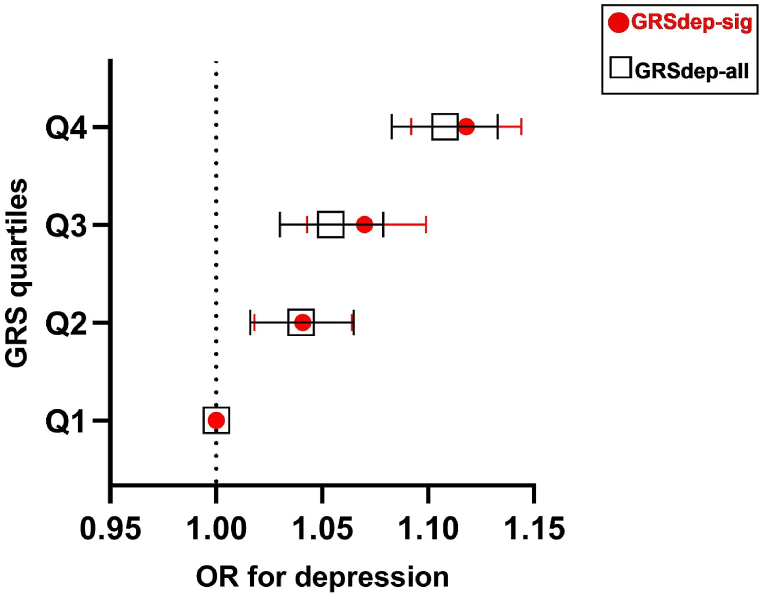
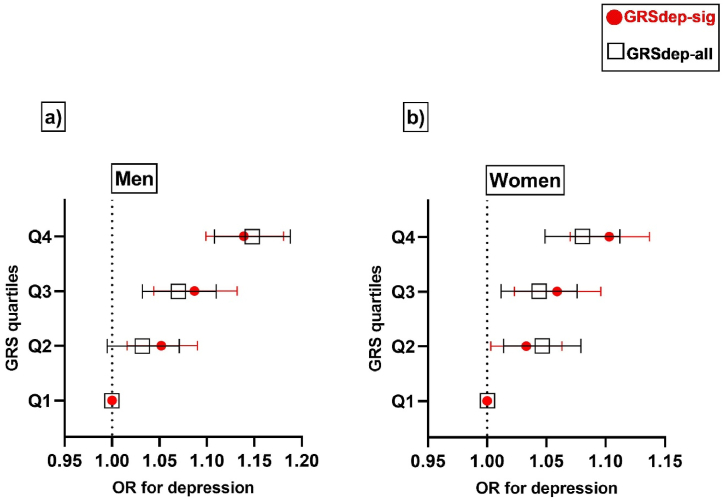
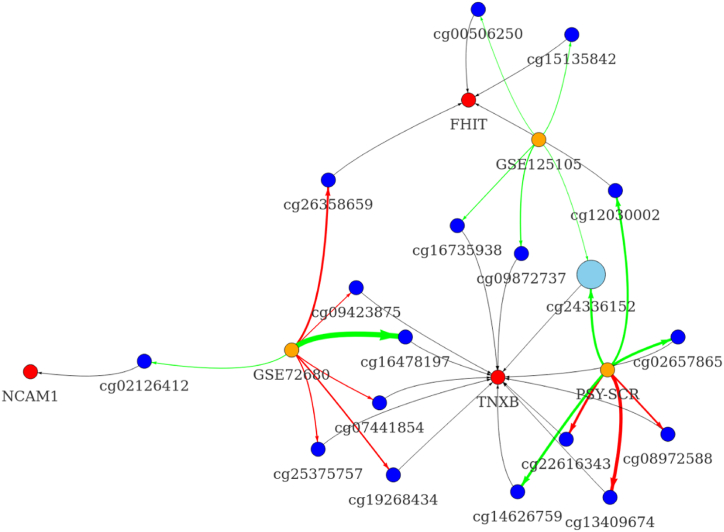
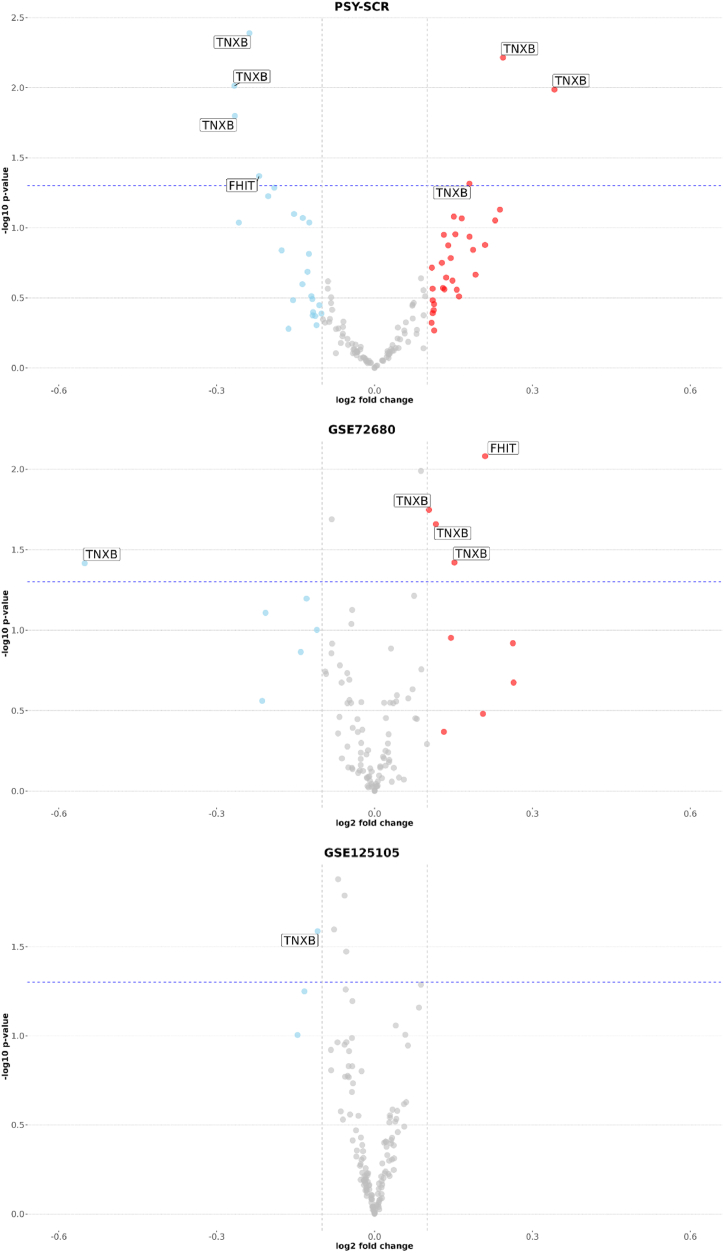
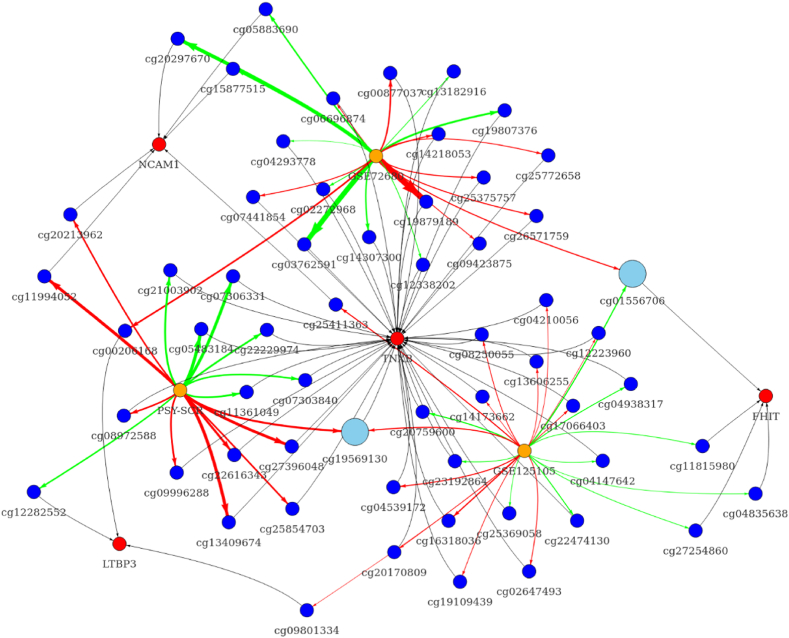
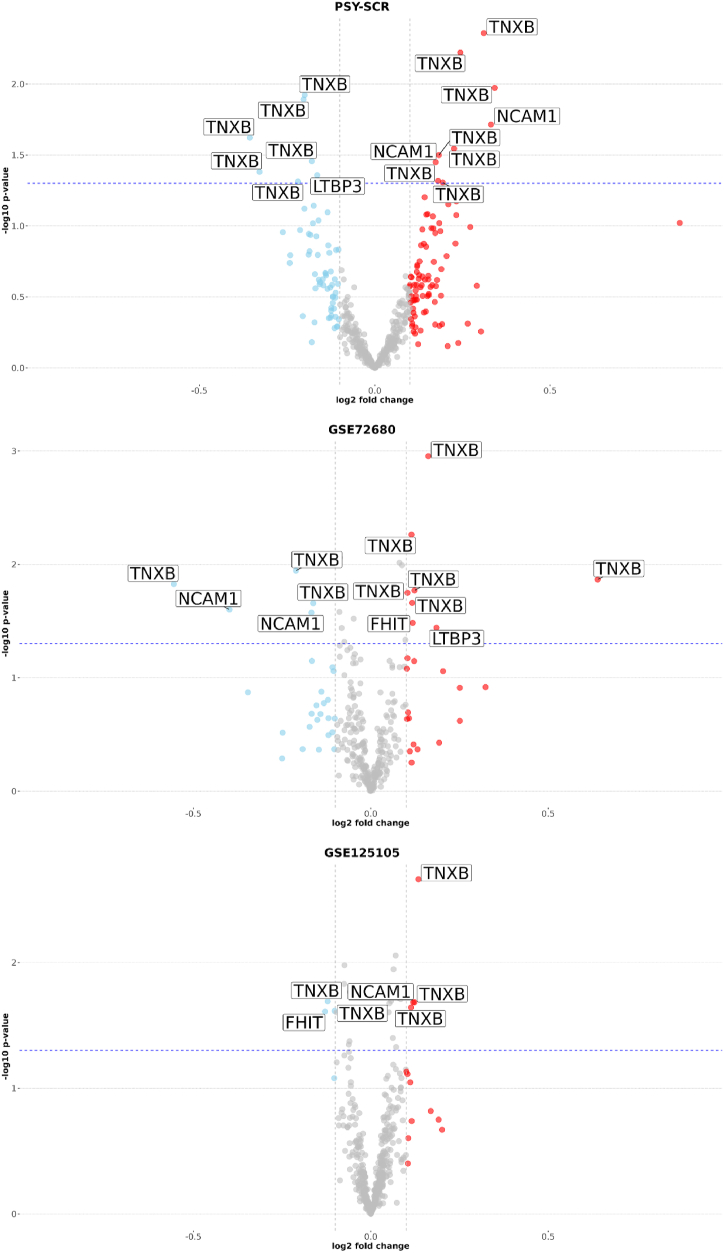
Depression is one of the most common psychiatric conditions resulting from a complex interaction of genetic, epigenetic and environmental factors. The present study aimed to identify independent genetic variants in the protein-coding genes that associate with depression and to analyze their transcriptomic and methylation profile. Data from the GWAS Catalogue was used to identify independent genetic variants for depression. The identified genetic variants were validated in the UK Biobank cohort and used to calculate a genetic risk score for depression. Data was also used from publicly available cohorts to conduct transcriptome and methylation analyses. Eight SNPs corresponding to six protein-coding genes (TNXB, NCAM1, LTBP3, BTN3A2, DAG1, FHIT) were identified that were highly associated with depression. These validated genetic variants for depression were used to calculate a genetic risk score that showed a significant association with depression (p < 0.05) but not with co-morbid traits. The transcriptome and methylation analyses suggested nominal significance for some gene probes (TNXB- and NCAM1) with depressed phenotype. The present study identified six protein-coding genes associated with depression and primarily involved in inflammation (TNXB), neuroplasticity (NCAM1 and LTBP3), immune response (BTN3A2), cell survival (DAG1) and circadian clock modification (FHIT). Our findings confirmed previous evidence for TNXB- and NCAM1 in the pathophysiology of depression and suggested new potential candidate genes (LTBP3, BTN3A2, DAG1 and FHIT) that warrant further investigation.

Keywords: Depression; Genetic risk score; Independent genetic variants; Methylation; Transcriptome; UK biobank.


Conflict of interest statement

All authors declare no conflict of interest.

Figures

Fig. 1
Fig. 1
Forest plot for the association of genetic risk scores with depression. This figure shows the association of genetic risk scores with depression for both genetic risk scores; GRSdep-sig and GRSdep-all. The X-axis shows the OR for depression; the Y-axis corresponds to the GRS quartiles. Error bar symbols and colors indicate the following: red dot – GRSdep-sig; black rectangle – GRSdep-all. The figure was created using Graphpad Prism 9. Abbreviations: GRS, genetic risk score; GRSdep-sig, genetic risk score for significant genetic variants, GRSdep-all, genetic risk score for all genetic variants.
Fig. 2
Fig. 2
Forest plot for the sex-stratified association of genetic risk scores with depression. This figure shows the sex-stratified association of genetic risk scores with depression for a) men and B) women for both genetic risk scores; GRSdep-sig and GRSdep-all. The X-axis shows the OR for depression; the Y-axis corresponds to the GRS quartiles. Error bar symbols and colors indicate the following: red dot – GRSdep-sig; black rectangle – GRSdep-all. The figure was created using Graphpad Prism 9. Abbreviations: GRS, genetic risk score; GRSdep-sig, genetic risk score for significant genetic variants, GRSdep-all, genetic risk score for all genetic variants.
Fig. 3
Fig. 3
Differential methylation analysis graph of promoter probes. This figure shows nominally significant results for differential methylation analysis of promoter-associated probes in three investigated cohorts. Node colors indicate the following: red – gene, blue – methylation site, light-blue – cross-significant methylation site, and orange – the cohort used. Edge color corresponds to the direction of the association, where green indicates downregulation and red – upregulation. The thickness of the edge is proportional to the effect size (absolute of log2 fold change) for a specific probe. Edges between a probe and associated gene are shown in black and thickness is constant. The image was created using the “visNetwork” R package. Abbreviations: NCAM1, neural cell adhesion molecule 1; FHIT, fragile histidine triad diadenosine triphosphatase; TNXB, tenascin XB.
Fig. 4
Fig. 4
Volcano plots for differential methylation analysis (promoter region). This figure shows volcano plots for differential methylation analysis of promoter-related CpGs in all three cohorts. The X-axis shows log2 fold change; the Y-axis corresponds to -log10 p-value. The blue dashed line indicates the threshold for nominal significance. Gray vertical lines indicate −0,1 and 0,1 thresholds for log2 fold change estimations. Dots in color indicate probes that have passed log2 fold change thresholds. Gene names are shown for probes that passed log2 fold change thresholds and nominal significance thresholds. This figure corresponds to data in Table S14.
Fig. 5
Fig. 5
Differential methylation analysis graph of gene body CpGs. This figure shows nominally significant results for differential methylation analysis of gene-body-associated probes in three investigated cohorts. Node colors indicate the following: red – gene, blue – methylation site, light-blue – cross-significant methylation site, and orange – the cohort used. Edge color corresponds to the direction of the association, where green indicates downregulation and red – upregulation. The thickness of the edge is proportional to the effect size (absolute of log2 fold change) for a specific probe. Edges between a probe and associated gene are shown in black and thickness is constant. The image was created using the “visNetwork” R package. Abbreviations: NCAM1, neural cell adhesion molecule 1; FHIT, fragile histidine triad diadenosine triphosphatase; TNXB, tenascin XB; LTBP3, Latent Transforming Growth Factor Beta Binding Protein 3.
Fig. 6
Fig. 6
Volcano plots for differential methylation analysis (gene body region). This figure shows volcano plots for differential methylation analysis of gene-body-associated CpGs in all three cohorts. The X-axis shows log2 fold change; the Y-axis corresponds to -log10 p-value. The blue dashed line indicates the threshold for nominal significance. Gray vertical lines indicate −0,1 and 0,1 thresholds for log2 fold change estimations. Dots in color indicate probes that have passed log2 fold change thresholds. Gene names are shown for probes that passed log2 fold change thresholds and nominal significance thresholds. This figure corresponds to data in Table S15.

Similar articles

References

    1. McCarron R.M., Shapiro B., Rawles J., Luo J. Depression. Ann. Intern. Med. 2021;174:ITC65–ITC80. - PubMed
    1. Wang J., et al. Prevalence of depression and depressive symptoms among outpatients: a systematic review and meta-analysis. BMJ Open. 2017;7 - PMC - PubMed
    1. Lang U.E., Borgwardt S. Molecular mechanisms of depression: perspectives on new treatment strategies. Cell. Physiol. Biochem. 2013;31:761–777. - PubMed
    1. Li Z., Page A., Martin G., Taylor R. Attributable risk of psychiatric and socio-economic factors for suicide from individual-level, population-based studies: a systematic review. Soc. Sci. Med. 2011;72:608–616. - PubMed
    1. Cavanagh J.T.O., Carson A.J., Sharpe M., Lawrie S.M. Psychological autopsy studies of suicide: a systematic review. Psychol. Med. 2003;33:395–405. - PubMed

LinkOut - more resources