. 2025 Jan 12;11(2):e41912.
doi: 10.1016/j.heliyon.2025.e41912. eCollection 2025 Jan 30.

Effects of housing conditions on health and gut microbiome of female cynomolgus monkeys and improvement of welfare by checking menstruation under socially housed condition

Affiliations

Effects of housing conditions on health and gut microbiome of female cynomolgus monkeys and improvement of welfare by checking menstruation under socially housed condition

Yunpeng Yang et al. Heliyon. .

Abstract

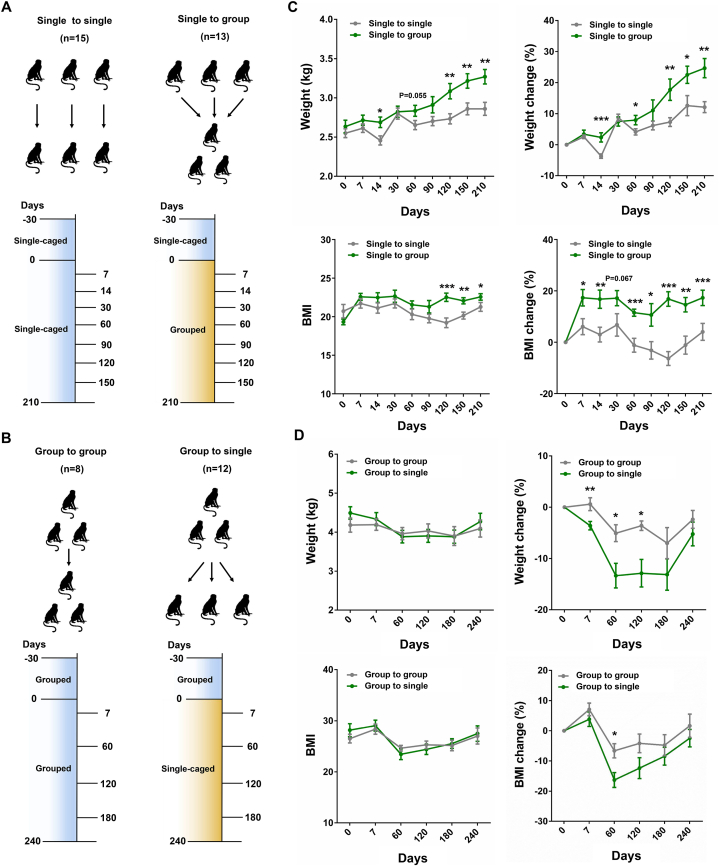
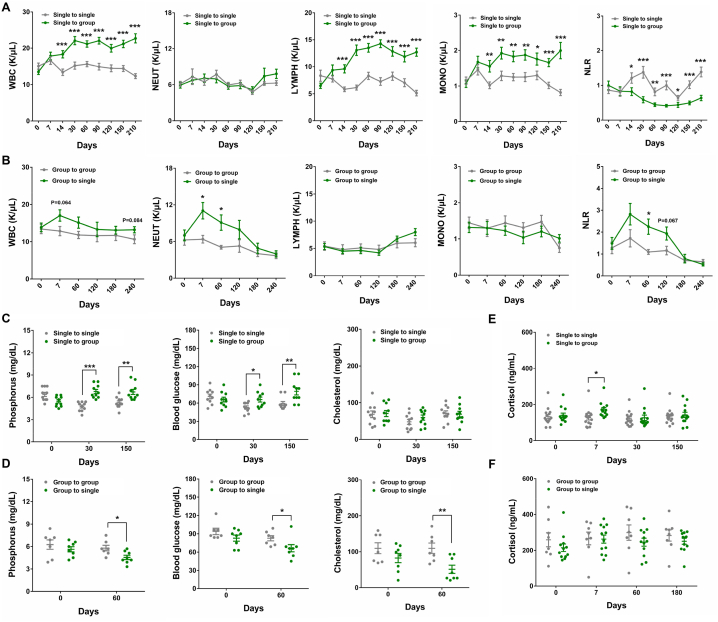
Laboratory non-human primates (NHPs) are commonly subjected to social deprivation in various scientific researches. However, the impact of social deprivation on gut microbiome remains largely unknown. We examined the health status and gut microbiota of female cynomolgus monkeys housed in isolation or social conditions and found that social deprivation brought adverse effects to monkeys by inhibiting their growth, remodeling the immune status, and decreasing the level of beneficial biochemical parameters. 16S rRNA gene sequencing revealed that the gut microbial composition and function differed between grouped and isolated monkeys. Specifically, grouping the single-caged young monkeys to socially housed condition could decrease the relative abundance of Firmicutes and increase the relative abundance of Bacteroidetes, while separating the socially housed middle-aged monkeys into single cages showed the opposite trend. Besides, training female monkeys to detect menstruation under socially-housed condition could increase their body weight change and adjusting their immune status, thus attenuating the adverse effects of separating them to single cages. Our results verified the significant role of grouping in mitigating adverse health and microbiota alterations caused by isolation in female cynomolgus monkeys and emphasized the importance of training NHPs to cooperate with experimental procedures under socially housed condition, which could not only improve the welfare of cynomolgus monkeys but also enhance the accuracy and reliability of scientific results.


Conflict of interest statement

The authors declare that they have no known competing financial interests or personal relationships that could have appeared to influence the work reported in this paper.

Figures

Fig. 1
Fig. 1
Examining the physical status of female cynomolgus monkeys housed in isolation and social conditions (A) Schematic diagram illustrating the strategies for grouping single-caged young monkeys to socially housed condition. Single to single, monkeys that housed in single cages before and during the experiment; Single to group, monkeys that housed in single cages before the experiment and then grouped to social housing condition during the experiment. The number of monkeys used in two monkey groups was listed in brackets. The monkeys used in this strategy were 2–3 years old. (B) Schematic diagram illustrating the strategies for separating grouped middle-aged monkeys into single cages. Group to group, monkeys that housed in social condition before and during the experiment; Group to single, monkeys that housed in social condition before the experiment and then divided into single cages during the experiment. The number of monkeys in two groups were listed in bracket. The monkeys used in this strategy were 10–15 years old. (C) The weight and BMI between the single-caged (single to single) and grouped (single to group) young monkeys. (D) The weight and BMI of middle-aged monkeys housed in social (group to group) and isolation (group to single) condition. Data are presented as mean ± SEM. The statistical significance between two monkey groups was analyzed using t-test (∗p < 0.05, ∗∗p < 0.01, ∗∗∗p < 0.001).
Fig. 2
Fig. 2
The routine blood and biochemical indexes of single-caged and grouped female cynomolgus monkeys (A) The comparison of routine blood indexes between the “single to single” (n = 15) and “single to group” (n = 13) young monkeys. (B) The comparison of routine blood indexes between the “group to group” (n = 8) and “group to single” (n = 12) middle-aged monkeys. (C) The comparison of serum phosphorus, glucose and cholesterol between the “single to single” (n = 10) and “single to group” (n = 10) young monkeys. (D) The comparison of serum phosphorus, glucose and cholesterol between the “group to group” (n = 7) and “group to single” (n = 8) middle-aged monkeys. (E) The serum concentration of cortisol in “single to single”(n = 15) and “single to group”(n = 13) young monkeys. (F) The serum concentration of cortisol in“group to group”(n = 8) and“group to single”(n = 12) middle-aged monkeys. Data are presented as mean ± SEM. The statistical significance between two monkey groups was analyzed using t-test (∗p < 0.05, ∗∗p < 0.01, ∗∗∗p < 0.001).
Fig. 3
Fig. 3
The gut microbiota composition of single-caged and grouped female cynomolgus monkeys (A) Principal coordinate analysis (PCoA) of weighted UniFrac distances between the “single to single” (n = 14) and “single to group” (n = 13) young monkeys at days 0, 7, 30 and 150. (B) Random forest-based identification of distinguishing taxa between the “single to single” and “single to group” young monkeys at day 30. The distinguishing taxa at phylum and genus level were listed. (C) LEfSe (Linear discriminant analysis Effect Size) analysis was used to analyze the gut microbial differences between the “single to single” and “single to group” monkey groups at day 30. LDA was set as 3.5. (D) Relative abundance of Firmicutes, Bacteroidetes, Lactobacillus, and Prevotella in the “single to single” and “single to group” monkey groups at day 30. (E) Principal coordinate analysis (PCoA) of weighted UniFrac distances between the “group to group” (n = 7) and “group to single” (n = 9) middle-aged monkeys at days 0, 7, 60, and 180. (F) Random forest-based identification of distinguishing taxa between the “group to group” and “group to single” middle-aged monkeys at day 7. The distinguishing taxa at phylum and genus level were listed. (G) LEfSe (Linear discriminant analysis Effect Size) analysis was used to analyze the gut microbial differences between the “group to group” and “group to single” monkey groups at day 7. LDA was set as 2.0. (H) Relative abundance of Firmicutes, Bacteroidetes, Blautia, and Bulleidia in the “group to group” and “group to single” monkey groups at day 7. Data are presented as mean ± SEM. The statistical significance between two monkey groups was analyzed using Mann-Whitney U test (Two-tailed) (∗p < 0.05, ∗∗p < 0.01, ∗∗∗p < 0.001).
Fig. 4
Fig. 4
PICRUSt2-predicted pathway abundances in the gut microbiota of young and middle-aged female cynomolgus monkeys housed in isolation or social conditions (A) The predicted second-level KEGG pathways that significantly affected by relocating single-caged young monkeys (single to single) into a group cage (single to group) at day 30. (B) The predicted second-level KEGG pathway that significantly affected by separating socially-housed middle-aged monkeys (group to group) into single cages (group to single) at day 7. Data are presented as mean ± SEM. The statistical significance between two monkey groups was analyzed using Mann-Whitney U test (Two-tailed) (∗p < 0.05, ∗∗p < 0.01, ∗∗∗p < 0.001).
Fig. 5
Fig. 5
Facilitating menstruation detection through PRT and its effect on the health status of female cynomolgus monkeys (A) Schematic diagram showing the strategy for PRT. The monkeys in cage 1 were left untrained and used as control; the monkeys in cage 2 were trained for menstruation detection at days 2, 13, and 27. Time recording for menstruation detection was conducted at days 0, 14, and 28. The collection of feces and blood were performed at days 0 and 28. (B) The time used for menstruation detection between the trained (n = 10) and untrained (control, n = 10) monkeys at days 0, 14, and 28. (C) Comparing the serum cortisol concentration between the trained monkeys and its untrained controls. (D) Comparing the percentage change of body weight between trained (n = 10) and untrained control (n = 10) monkeys at day 28. The percentage body weight change was calculated based on the following fomula: (weight at day 28 minus weight at day 0)/weight at day 0. (E) Comparison of WBC, LYMPH, NEUT, and MONO between the trained (n = 10) and untrained control (n = 10) monkeys assayed before (day 0) and after (day 28) the training process. (F) Comparison of serum concentration of cholesterol and calcium between the trained (n = 10) and untrained control (n = 10) monkeys assayed before (day 0) and after (day 28) the training process. Data are presented as mean ± SEM. The statistical significance between two monkey groups was analyzed using t-test (∗p < 0.05, ∗∗p < 0.01, ∗∗∗p < 0.001).
Fig. 6
Fig. 6
The comparison of gut microbiota between trained and untrained control monkeys (A) Schematic diagram showing the fecal samples collected for 16S rRNA gene sequencing. Pre-control, fecal samples collected from the untrained control monkeys before the experiment (day 0) (n = 10); Post-control, fecal samples collected from the untrained control monkeys after the experiment (day 28) (n = 10); Pre-trained, fecal samples collected from the trained monkeys before the experiment (day 0) (n = 10); Post-trained, fecal samples collected from the trained monkeys after the experiment (day 28) (n = 10). (B) The richness and sample diversity of gut microbiota between the trained and untrained control monkeys. (C) Principal coordinate analysis of weighted UniFrac distances between the gut microbiota of trained and untrained control monkeys collected before and after the experiment. (D) Relative abundance of top ten taxa assigned at phylum, family, and genus levels in trained and untrained control monkeys before and after the experiment.

Similar articles

References

    1. Jennings M., Batchelor G.R., Brain P.F., Dick A., Elliott H., Francis R.J., Hubrecht R.C., Hurst J.L., Morton D.B., Peters A.G., et al. Refining rodent husbandry: the mouse. Report of the rodent refinement working party. Lab. Anim. 1998;32:233–259. doi: 10.1258/002367798780559301. - DOI - PubMed
    1. Olsson I.A., Dahlborn K. Improving housing conditions for laboratory mice: a review of "environmental enrichment". Lab. Anim. 2002;36:243–270. doi: 10.1258/002367702320162379. - DOI - PubMed
    1. Smith A.L., Corrow D.J. Modifications to husbandry and housing conditions of laboratory rodents for improved well-being. ILAR J. 2005;46:140–147. doi: 10.1093/ilar.46.2.140. - DOI - PubMed
    1. Dunphy-Doherty F., O'Mahony S.M., Peterson V.L., O'Sullivan O., Crispie F., Cotter P.D., Wigmore P., King M.V., Cryan J.F., Fone K.C.F. Post-weaning social isolation of rats leads to long-term disruption of the gut microbiota-immune-brain axis. Brain Behav. Immun. 2018;68:261–273. doi: 10.1016/j.bbi.2017.10.024. - DOI - PubMed
    1. Sun Q., Dong J., Yang W., Jin Y., Yang M., Wang Y., Wang P.L., Hu Y., Tsien J.Z. Efficient reproduction of cynomolgus monkey using pronuclear embryo transfer technique. Proc. Natl. Acad. Sci. U S A. 2008;105:12956–12960. doi: 10.1073/pnas.0805639105. - DOI - PMC - PubMed

LinkOut - more resources