. 2025 Jan 2;28(2):111730.
doi: 10.1016/j.isci.2024.111730. eCollection 2025 Feb 21.

Low dimensionality of phenotypic space as an emergent property of coordinated teams in biological regulatory networks

Affiliations

Low dimensionality of phenotypic space as an emergent property of coordinated teams in biological regulatory networks

Kishore Hari et al. iScience. .

Abstract

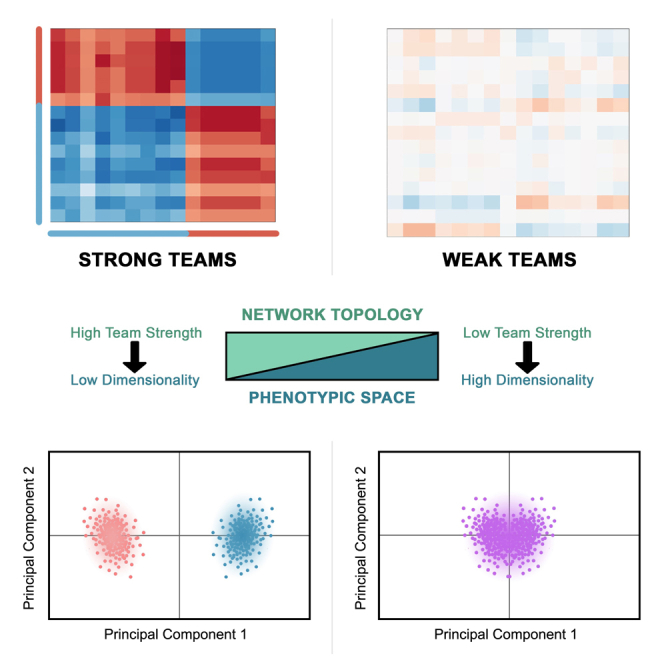
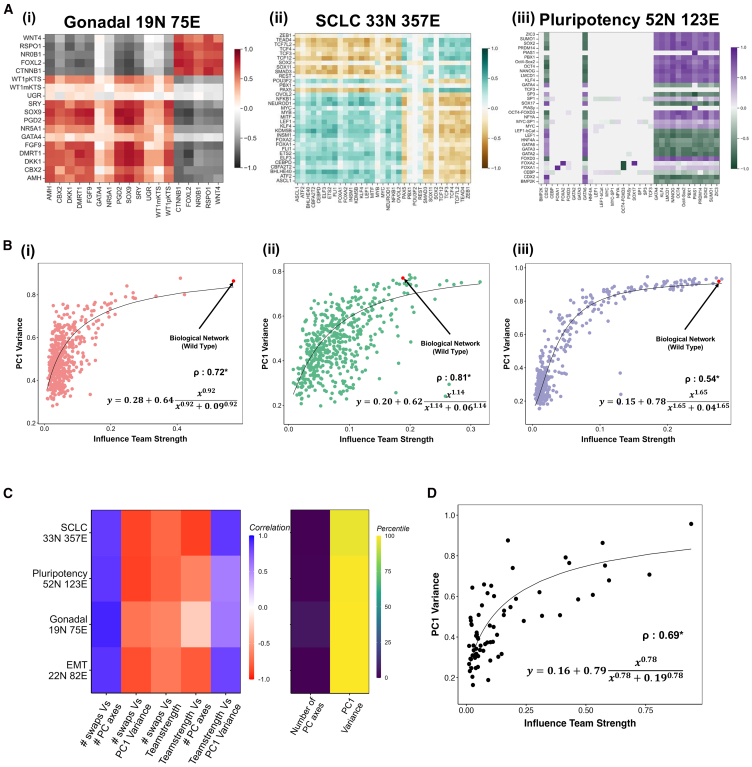
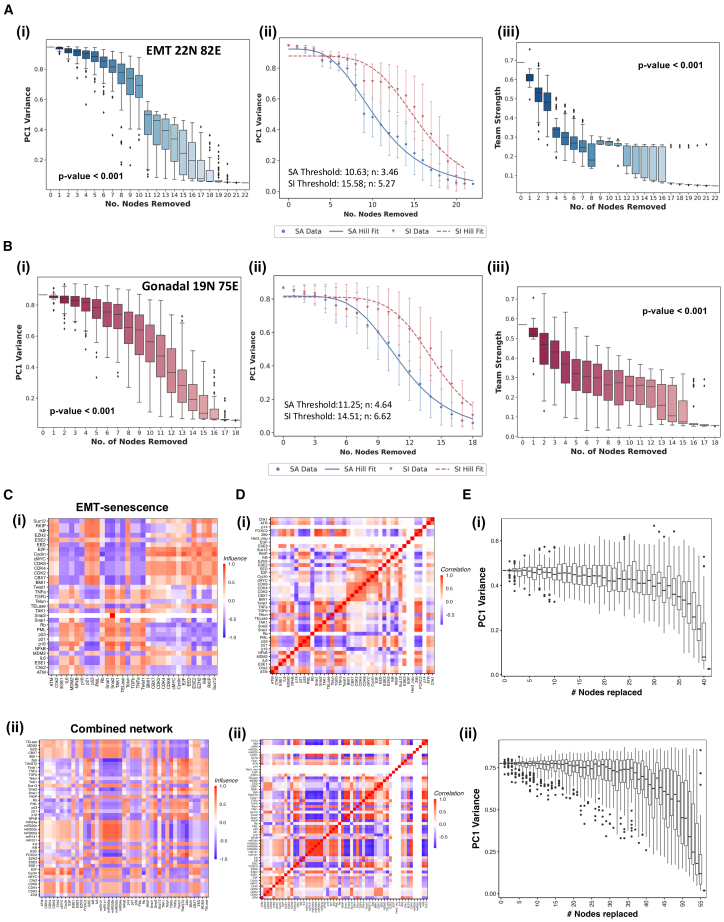
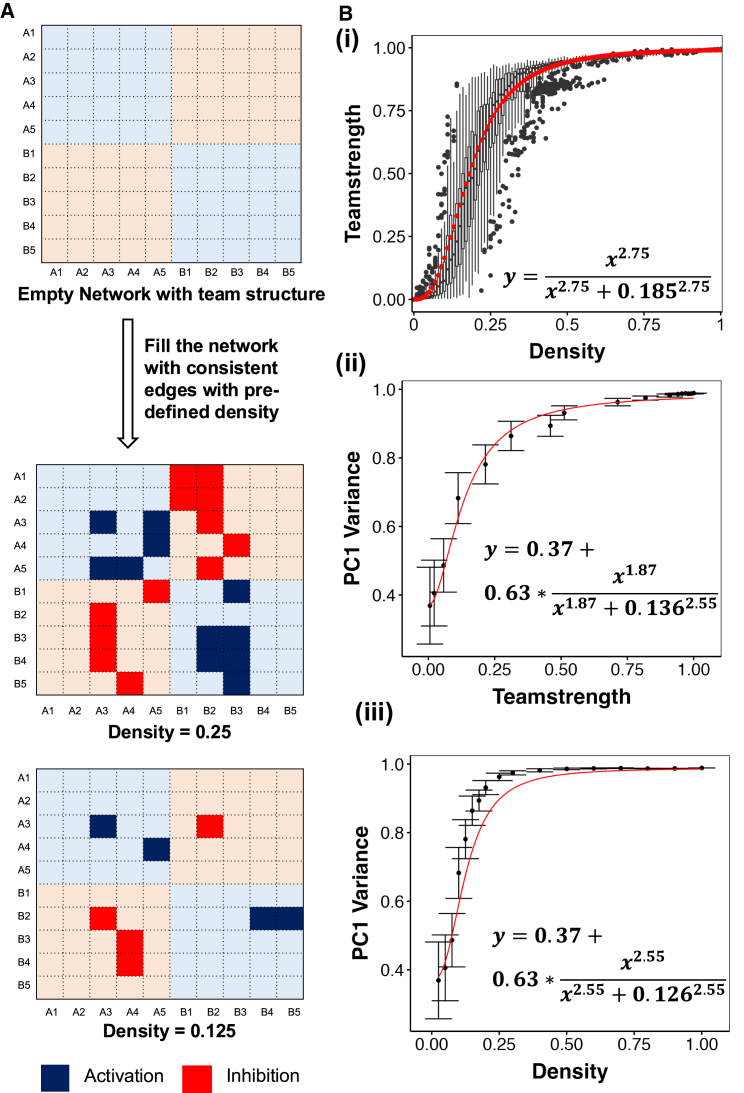
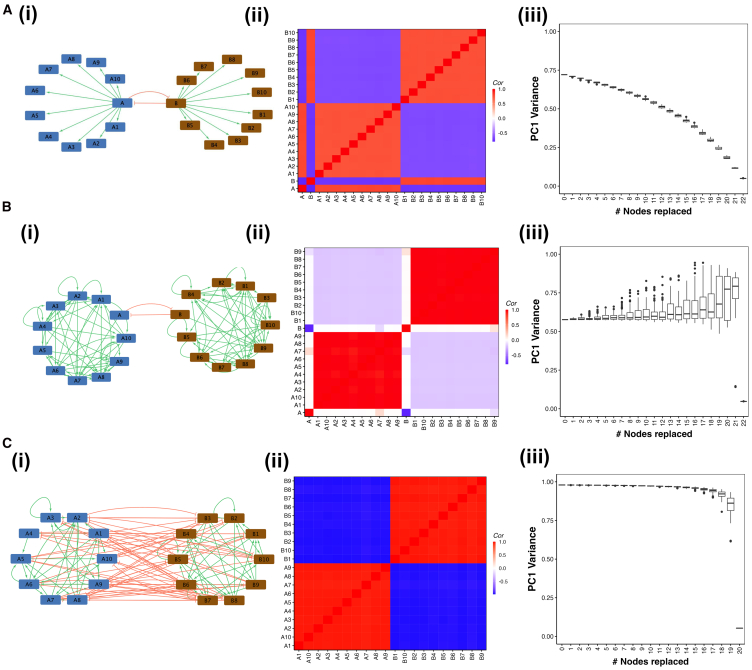
Cell-fate decisions involve coordinated genome-wide expression changes, typically leading to a limited number of phenotypes. Although often modeled as simple toggle switches, these rather simplistic representations often disregard the complexity of regulatory networks governing these changes. Here, we unravel design principles underlying complex cell decision-making networks in multiple contexts. We show that the emergent dynamics of these networks and corresponding transcriptomic data are consistently low-dimensional, as quantified by the variance explained by principal component 1 (PC1). This low dimensionality in phenotypic space arises from extensive feedback loops in these networks arranged to effectively enable the formation of two teams of mutually inhibiting nodes. We use team strength as a metric to quantify these feedback interactions and show its strong correlation with PC1 variance. Using artificial networks of varied topologies, we also establish the conditions for generating canalized cell-fate landscapes, offering insights into diverse binary cellular decision-making networks.

Keywords: Systems biology.


Conflict of interest statement

The authors declare no competing financial or non-financial interests.

Figures

None
Graphical abstract
Figure 1
Figure 1
Low-dimensionality in bulk transcriptomic data (A) (i) Pairwise correlation of expression for the 32 genes of SCLC network in the CCLE SCLC cell-line data. (ii). Coefficients of the first principal component axis for the geneset-cell line combination in (i). (iii) Scatterplot of CCLE expression data on the PC 1 and 2 axes. The color bar represents the phenotypic score of each sample. (B) Same as A, but for CCLE non-SCLC cell lines for EMT signature. (C) PC1 Variance against the number of genes replaced with housekeeping genes for (i) CCLE SCLC cell lines with SCLC gene signature, (ii) GTEx Lung tissue samples with Alveolar fibrotic-epithelial signature obtained from MSigDB. (D) Same as C, but for GTEx samples with (i) 50 gene SCLC signature and (ii) a random gene signature. (E) Boxplots depicting the comparison of (i) the number of genes replaced corresponding to half maximum PC1 and (ii) the difference in slopes before and after half maximum of mean PC1 vs. number of genes replaced between the pooled biological genesets and housekeeping genes.
Figure 2
Figure 2
Structural similarities between teams and PC1 axis (A) The network diagram (i) and the influence matrix (ii) for the 22N 82E EMP network. (iii) Correlation matrix depicting the pairwise correlations between the node expression levels across all parameter sets in RACIPE. (B) (i) Scatterplot mapping the solutions generated from RACIPE on the axes of PC1 and PC2. (ii-iv) Heatmaps depicting the expression levels of the nodes of the network for each individual cluster seen in (i). (C) The loadings of the nodes for each PC1 axis. The colors of the bars represent the team identity of the nodes. (D) (i) Depiction of network randomization. (ii) Influence matrix of a random network. (iii) Correlation matrix generated for a random network. (iv) Scatterplot similar to C (i) but for a random network. (v) Similar to D but for a random network.
Figure 3
Figure 3
Strong teams lead to a low-dimensional steady-state space (A) (i) Histogram depicting the variance explained by PC1 for random networks. A vertical red line represents the EMP network. (ii) Scatterplot depicting the dependence of variance explained by PC1 on the team strength. Each point is a random network. The biological network has been pointed out. The Spearman correlation coefficient, ρ, is reported, with ∗ indicating a p – value < 0.05. (B) (i) Histogram depicting the number of PCs required to explain 90% variance in random networks. A vertical red line represents the EMP network. (ii) Boxplot depicting the dependence of the number of PCs required to explain 90% of the variance in steady states on the team strength. The p-value for one-way ANOVA and the Spearman correlation coefficient (ρ) have been reported, with ∗ indicating a p – value <0.05. (C) PC1 variance as a function of the number of swaps used to generate random networks.
Figure 4
Figure 4
Team structure leads to low-dimensionality of steady-state space in SCLC, iPSC, and gonadal cell-fate decision networks (A) Influence matrices for (i) Gonadal, (ii) SCLC, and (iii) iPSC network. (B) Scatterplot depicting the dependence of variance explained by PC1 on the team strength for (i) Gonadal, (ii) SCLC, and (iii) iPSC network. Each point is a random network. The biological network has been pointed out. The Spearman correlation coefficient (ρ) is reported, with ∗ indicating a p – value <0.05. (C) Heatmap depicting the percentile of Biological networks for PC1 Variance, number of PC axes in random networks, and correlation strength between different metrics analyzed here. (D) Scatterplot of PC1 variance against team strength for networks from cell collective database. The Spearman correlation coefficient (ρ) is reported, with ∗ indicating a p – value <0.05.
Figure 5
Figure 5
Teams provide robustness to low-dimensionality against internal and external perturbations (A) For the 22N EMT network, (i) Boxplot describing the change in PC1 Variance with the number of nodes replaced with self-activating disconnected nodes, (ii) Mean ± sd PC1 variance against the number of nodes replaced with self-activating (blue) and self-inhibiting (red) disconnected nodes, (iii) Team strength against the number of nodes replaced. Fits to the sigmoidal curve are shown using blue and red lines in (ii), and the corresponding parameters are reported in the plot. (B) Same as A but for the Gonadal cell-fate network. (C) Influence matrices of the EMT senescence network before (i) and after (ii) addition of the strong teamed 22N 82E EMP network. (D) Correlation matrices of the EMT senescence network before (i) and after (ii) addition of the strong teamed 22N 82E EMP network. (E) Boxplots depicting PC1 stability of the (i) EMT senescence and (ii) combined networks.
Figure 6
Figure 6
Artificial network analysis to validate the generalizability of team strength as a predictor of PC1 variance (A) Schematic for generating artificial networks with teams. (B) (i) Boxplots depicting the change in team strength as a function of the density of the artificial networks. (ii) Scatterplot depicting the change in PC1 Variance with team strength of artificial networks. (iii) Same as (ii), but with density. The error bars in (ii) and (iii) represent mean ± standard deviation.
Figure 7
Figure 7
Teams are necessary to achieve PC1 stability (A) Correlation and PC1 stability analysis for a toggle switch between master regulators. Each master regulator activates multiple nodes corresponding to their phenotype, forming a hub. (B) Same as A, but for master regulators activating teams of nodes. (C) Same as A, but for a network with mutually inhibiting teams.

Similar articles

Cited by

References

    1. Vickaryous M.K., Hall B.K. Human cell type diversity, evolution, develop- ment, and classification with special reference to cells derived from the neural crest. Bio- logical Reviews. 2006;81:425–455. doi: 10.1017/s1464793106007068. - DOI - PubMed
    1. Tabula Sapiens Consortium, Jones R.C., Karkanias J., Krasnow M.A., Pisco A.O., Quake S.R., Salzman J., Yosef N., Bulthaup B., Brown P., et al. The Tabula Sapiens: A multiple- organ, single-cell transcriptomic atlas of humans. Science. 2022;376 doi: 10.1126/science.abl4896.eprint. - DOI - PMC - PubMed
    1. Gulati G.S., Sikandar S.S., Wesche D.J., Manjunath A., Bharadwaj A., Berger M.J., Ilagan F., Kuo A.H., Hsieh R.W., Cai S., et al. Single-cell transcriptional diversity is a hallmark of developmental potential. Science. 2020;367:405–411. doi: 10.1126/science.aax0249. - DOI - PMC - PubMed
    1. Jolly M.K., Ware K.E., Gilja S., Somarelli J.A., Levine H. EMT and MET: necessary or permissive for metastasis? Mol. Oncol. 2017;11:755–769. doi: 10.1002/1878-0261.12083. - DOI - PMC - PubMed
    1. Hari K., Ullanat V., Balasubramanian A., Gopalan A., Jolly M.K. Landscape of epithelial–mesenchymal plasticity as an emergent property of coordinated teams in regulatory networks. eLife. 2022;11 doi: 10.7554/eLife.76535. - DOI - PMC - PubMed

LinkOut - more resources