. 2025 Jan 4;28(2):111745.
doi: 10.1016/j.isci.2025.111745. eCollection 2025 Feb 21.

Nuclear talin-1 provides a bridge between cell adhesion and gene expression

Affiliations

Nuclear talin-1 provides a bridge between cell adhesion and gene expression

Alejandro J Da Silva et al. iScience. .

Abstract

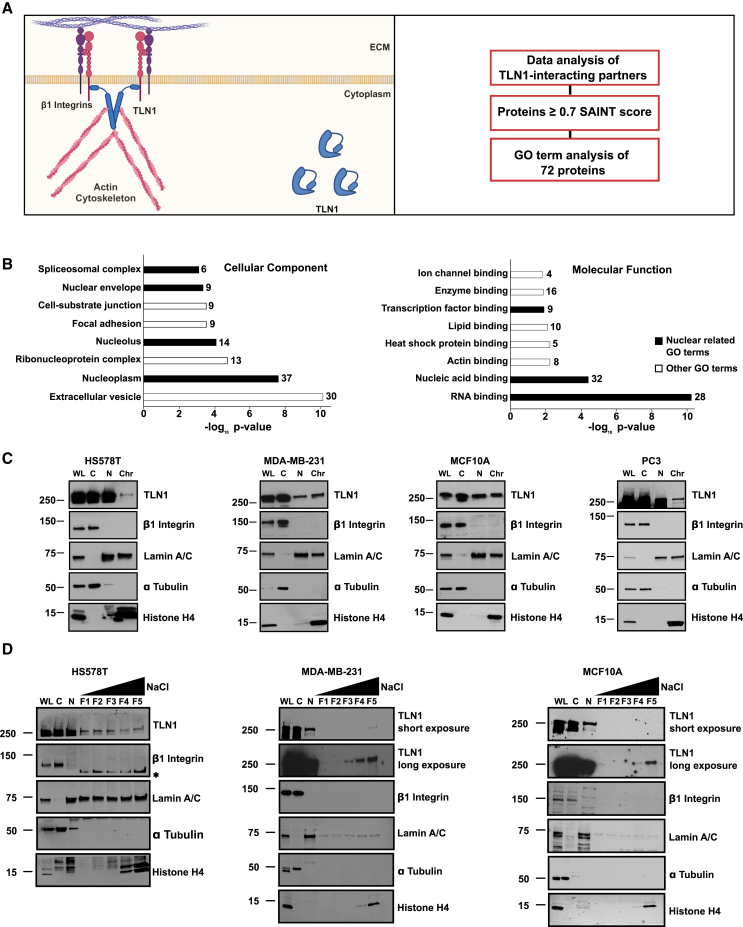
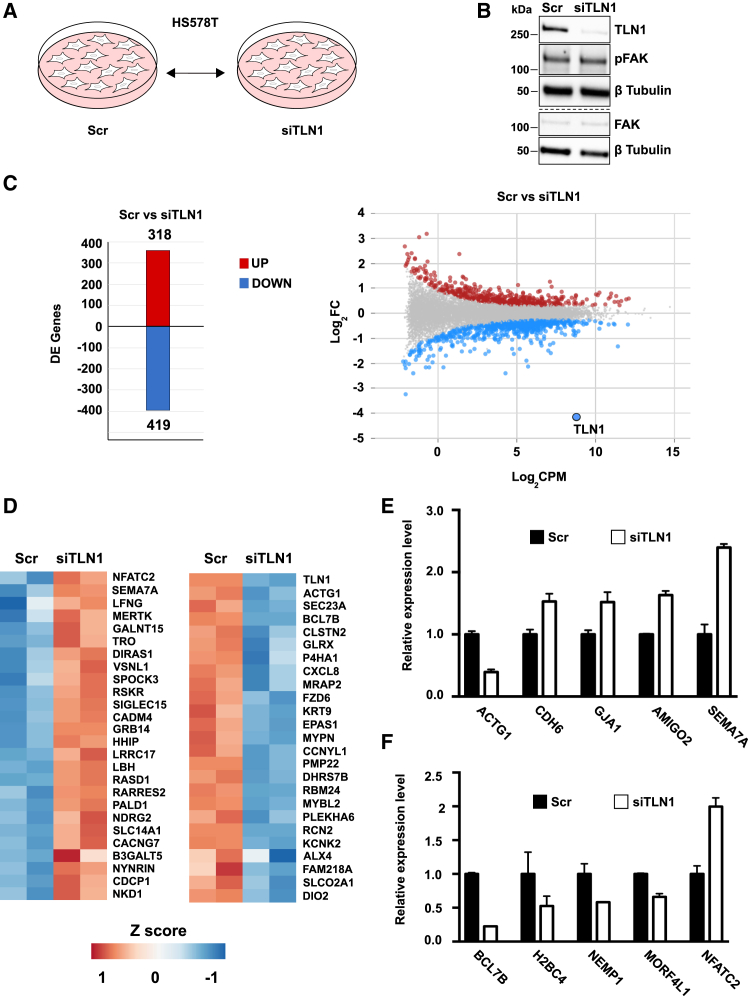
Talin-1 (TLN1) is best known to activate integrin receptors and transmit mechanical stimuli to the actin cytoskeleton at focal adhesions. However, the localization of TLN1 is not restricted to focal adhesions. By utilizing both subcellular fractionations and confocal microscopy analyses, we show that TLN1 localizes to the nucleus in several human cell lines, where it is tightly associated with the chromatin. Importantly, small interfering RNA (siRNA)-mediated depletion of endogenous TLN1 triggers extensive changes in the gene expression profile of human breast epithelial cells. To determine the functional impact of nuclear TLN1, we expressed a TLN1 fusion protein containing a nuclear localization signal. Our findings revealed that the accumulation of nuclear TLN1 alters the expression of a subset of genes and impairs the formation of cell-cell clusters. This study introduces an additional perspective on the canonical view of TLN1 subcellular localization and function.

Keywords: cell biology; cellular physiology; molecular biology; molecular interaction; properties of biomolecules.


Conflict of interest statement

The authors declare no competing interests.

Figures

None
Graphical abstract
Figure 1
Figure 1
TLN1 is localized in the nucleus where it strongly interacts with the chromatin (A) A schematic overview of the established subcellular localization of Talin-1 (TLN1) according to the current literature. TLN1 is localized in the focal adhesions and the cytoplasm (left). Analysis of TLN1-interacting partners previously identified by Gough and collaborators (right). Made in BioRender.com. (B) Gene ontology (GO) terms associated with TLN1-interacting partners were analyzed with the online application ShinyGO. The GO terms within the “cellular component” and “molecular function” ontologies were ranked according to their p values and the redundant terms were withdrawn. The number of proteins associated with each term is indicated, and terms composed of less than four proteins are not shown. GO terms related to the nucleus are highlighted in black. (C) Immunoblot analysis of TLN1 in subcellular fractionations of HS578T, MDA-MB-231, MCF10A, and PC3 cells. WL, whole-cell lysate; C, cytoplasmic fraction; N, nuclear fraction; Chr, chromatin fraction. To monitor the purity of the fractionation protocol, the following controls were used: β1 integrin (plasma membrane), lamin A/C (nucleus), α-tubulin (cytoplasm), histone H4 (chromatin). (D) Immunoblot analysis of TLN1 in differential salt fractionation of HS578T, MDA-MB-231, and MCF10A cells. F1: 0.3, F2: 0.45, F3: 0.6, F4: 0.8, and F5: 1.2 M of NaCl. The fractionation controls were the same as in (C), and remnant signal from a previous lamin A/C immunoblot is indicated with an asterisk (∗). See also Tables S1 and S2.
Figure 2
Figure 2
Nuclear TLN1 immunofluorescence signal is reduced upon TLN1 depletion (A) A schematic overview of single focal planes shown in (B) and (C). (B) Confocal microscopy images of TLN1 immunofluorescence staining in HS578T and MDA-MB-231 cells. Scale bar 10 μm. (C) Confocal microscopy images of TLN1 immunofluorescence staining in HS578T transfected with either Scr or siTLN1 RNA. Lamin A/C and DAPI were used as nuclear markers. Scale bar 10 μm. All images are representative of three biological replicates. (D) Quantification of voxel intensity values within the nucleus. The data whiskers represent minimum and maximum values. The statistical significance was analyzed with a Mann-Whitney test; ∗∗∗∗ p value <0.0001. The data represent three biological replicas, 98–132 nuclei in total. (E) Immunoblot analysis of TLN1 expression in HS578T cells transfected with either Scr or siTLN1. HSC70 was used as a loading control (left). The whole lane intensity in the TLN1 blot was normalized to the respective HSC70 level. The data are presented as mean values + SD of three biological replicas. The statistical significance was analyzed with two-tailed Student’s t test; ∗p value < 0.05. See also Figure S1C.
Figure 3
Figure 3
Depletion of TLN1 triggers extensive changes in gene expression (A) A schematic overview of the experimental setup for RNA-seq. HS578T cells were transfected with either Scr or siTLN1, and the total RNA from each cell population was extracted and analyzed by RNA-seq. The arrows depict the comparison made for the RNA-seq analysis. (B) Immunoblot analysis of TLN1, FAK, and phosphorylated FAK (pFAK) levels in HS578T cells transfected with either Scr or siTLN1. β-tubulin was used as a loading control. The dotted line denotes blots from two distinct membranes with the same samples. Two biological replicas were used for this experiment. (C) Differentially expressed (DE) genes in the Scr vs. siTLN1 comparison were determined by Bioconductor R package edgeR (log2 FC at least ±0.5; FDR < 0.05). The number of upregulated and downregulated genes are indicated with red and blue bars, respectively (left). Individual DE genes between the Scr and siTLN1 samples were visualized in an MA plot. TLN1 is highlighted (right). (D) The top 50 DE genes were used to generate heatmaps with the CRAN R package pheatmap. The top 25 upregulated and downregulated genes are shown in the left and right, respectively. (E and F) Relative expression levels of five DE genes related to cell adhesion (E) and nuclear functions (F). Error bars +SD. Note that these genes were chosen from the list of total DE genes, see also Table S4.
Figure 4
Figure 4
Nuclear TLN1 affects gene expression (A) A schematic overview of the experimental setup to test the role of nuclear TLN1 for gene expression in HS578T cells (left). Confocal microscopy images corresponding to maximum intensity projections of the fluorescent signal emitted by GFP-NLS or the TLN1-NLS construct (right). Scale bar 10 μm. (B) mRNA expression of semaphorin 7A (SEMA7A), nuclear factor of activated T cell 2 (NFATC2), actin gamma 1 (ACTG1), BAF chromatin remodeling complex subunit BCL7B (BCL7B), and SEC23 homolog A (SEC23A) in HS578T cells. The mRNA levels were quantified with qRT-PCR, and GAPDH was used as a housekeeping gene. The data are presented as mean values + SEM of three biological replicates. The statistical significance was analyzed with paired two-tailed Student’s t test; ns: not significant, ∗p value < 0.05. (C) Differentially expressed (DE) genes between the Scr and siTLN1 comparison pair within the GO term cell-cell adhesion. Upregulated and downregulated genes are shown in the left and right, respectively. (D) Representative images of spheroid-like structures in ultra-low attachment plates, scale bar 100 μm (upper). Quantitative analysis of spheroid area (lower). The relative area was quantified in Fiji (ImageJ, version: 1.53t), using the BioVoxxel Toolbox plugin. Results were plotted with mean ± SEM from three biological replicates, 20–23 spheroid images in total. The statistical significance was analyzed with two-tailed Student’s t test; ∗p value < 0.05. See also Table S5.
Figure 5
Figure 5
Model of the subcellular localization of TLN1 and its impact on cell-cell adhesion Aside from the focal adhesions and cytoplasm, TLN1 is present in the nucleus, where it associates with the chromatin, causing changes in gene expression programs. TLN1 is represented in open and closed conformations in different subnuclear locations, but the precise conformation of nuclear TLN1 remains to be determined. It is plausible that nuclear TLN1 interacts with the LINC complex and that it responds to mechanical stimuli in the nucleus through interacting with proteins of this complex (upper). Finally, cells with enriched levels of nuclear TLN1 exhibit a lower capability to form cell-cell contacts when compared to cells where nuclear TLN1 is not enriched (lower). Made with BioRender.com.

References

    1. Zheng H.C., Jiang H.M. Shuttling of cellular proteins between the plasma membrane and nucleus (Review) Mol. Med. Rep. 2022;25:14. doi: 10.3892/mmr.2021.12530. - DOI - PMC - PubMed
    1. Hintermann E., Christen U. The many roles of cell adhesion molecules in hepatic fibrosis. Cells. 2019;8:1503. doi: 10.3390/cells8121503. - DOI - PMC - PubMed
    1. Byron A., Griffith B.G.C., Herrero A., Loftus A.E.P., Koeleman E.S., Kogerman L., Dawson J.C., McGivern N., Culley J., Grimes G.R., et al. Characterisation of a nucleo-adhesome. Nat. Commun. 2022;13:3053. doi: 10.1038/s41467-022-30556-5. - DOI - PMC - PubMed
    1. Gough R.E., Goult B.T. The tale of two talins – two isoforms to fine-tune integrin signalling. FEBS Lett. 2018;592:2108–2125. doi: 10.1002/1873-3468.13081. - DOI - PMC - PubMed
    1. Case L.B., Waterman C.M. Integration of actin dynamics and cell adhesion by a three-dimensional, mechanosensitive molecular clutch. Nat. Cell Biol. 2015;17:955–963. doi: 10.1038/ncb3191. - DOI - PMC - PubMed

LinkOut - more resources