. 2025 Feb 15;14(2):BIO061630.
doi: 10.1242/bio.061630. Epub 2025 Feb 3.

A high-resolution bovine mitochondrial co-expression network

Affiliations

A high-resolution bovine mitochondrial co-expression network

Pâmela A Alexandre et al. Biol Open. .

Abstract

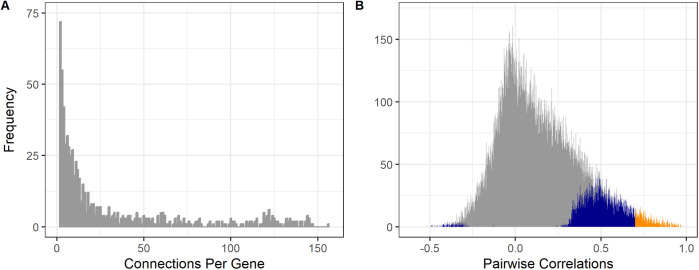
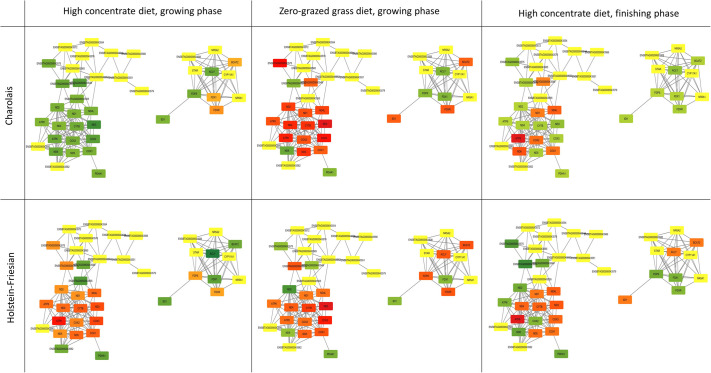
The mitochondrion is a sophisticated, versatile, and dynamic organelle whose function is incompletely understood. Intending to provide a framework for mitochondrial visualisation and interpretation of genome-wide molecular data, we reverse-engineered a co-expression network whose final structure represented mRNA encoding more than half of the entire mitochondrial proteome. We drew upon 723 RNA-seq data sets representing 91 tissues and cell types from 441 individual cattle. A mitochondrial landscape was formed comprising a main network and many smaller sub-networks. One of the discrete sub-networks contains all 13 mRNA (e.g. MT-ND1, MT -CYTB, MT -COX2, MT -ATP8) plus 15/22 tRNA (e.g. MT-TT) encoded by the mt-genome itself, indicating some independent regulation from the nuclear genome with whom it must cooperate. Intriguingly, this mtDNA sub-network also contains a single nuclear-encoded gene, that of PDHA1. PDHA1 encodes a subunit of the pyruvate dehydrogenase complex that governs the conversion of pyruvate to Acetyl CoA. This enzyme is extremely influential, representing the fundamental cellular connection between the ancient, conserved pathway of glycolysis that occurs exclusively in the cytoplasm, and the TCA cycle that occurs within the mitochondrial matrix. To demonstrate the downstream utility of our approach, we overlaid Longissimus dorsi muscle transcriptome data from differentially feed efficient Charolais and Holstein Friesian cattle. This approach highlighted expression patterns sensitive to both breed and diet in a complex manner. An analytic advantage of this approach is that relatively subtle (<2-fold) but coordinated changes that may be overlooked by conventional gene-by-gene significance testing become readily apparent. Finally, intending to understand the transcriptional regulation of mitochondrial function more thoroughly, we engineered a network built with transcription factors in addition to those mRNA encoding mitochondrial proteins. Here, a set of influential nuclear hormone receptors (e.g. PPARA) are enriched among the most highly and/or well-connected TF.

Keywords: Beef cattle; Feed efficiency; Organelle; Partial correlation; RNAseq.


Conflict of interest statement

Competing interests The authors declare no competing or financial interests.

Figures

Fig. 1.
Fig. 1.
Frequency distribution of (A) the number of connections per gene (degree) in the mitochondria co-expression network comprising 872 nodes and 12,445 edges, and (B) all pairwise correlations among all tested genes with significant correlations stronger than ±0.7 represented in orange and the remaining significant correlations represented in blue.
Fig. 2.
Fig. 2.
Mitochondrial co-expression network. Squared nodes represent 872 mRNA coloured based on cell localization according to MitoCarta 3.0, namely matrix, inner membrane (MIM), intermembrane space (IMS), outer membrane (MOM), mitochondrial membrane, or unknown. Mitochondrial encoded genes are highlighted by black borders. Edges thickness represents the strength of the correlations. Modules of genes related to similar biological processes are highlighted. The largest modules are dominated by mRNA encoding matrix and inner membrane proteins, respectively. Sub-networks include those comprising mRNA encoded by the mtDNA genome; biosynthetic reactions; uncoupling; protein synthesis and bioenergetic flux; and mitochondrial genomic control.
Fig. 3.
Fig. 3.
Mitochondrial co-expression network extract - mtDNA genome, biosynthesis and uncoupling modules. Nodes are coloured based on cell localization according to MitoCarta 3.0, namely matrix, inner membrane (MIM), intermembrane space (IMS), outer membrane (MOM), or unknown. Mitochondrial encoded genes are highlighted by black borders. Edges thickness represents the strength of the correlations.
Fig. 4.
Fig. 4.
Mitochondrial co-expression network extract - protein synthesis and bioenergetic module. Nodes are coloured based on cell localization according to MitoCarta 3.0, namely matrix, inner membrane (MIM), intermembrane space (IMS) or outer membrane (MOM). Edges thickness represents the strength of the correlations.
Fig. 5.
Fig. 5.
Mitochondrial co-expression network extract - mitochondrial genome control module. Nodes are coloured based on cell localization according to MitoCarta 3.0, namely matrix, inner membrane (MIM), intermembrane space (IMS), outer membrane (MOM), mitochondrial membrane or unknown. Edge thickness represents the strength of the correlations.
Fig. 6.
Fig. 6.
Overlay of feed efficiency-related gene expression on mitochondrial co-expression network. Mitochondrial co-expression network node colour continuously mapped to muscle differential expression (log2 fold change) from cattle divergent in feed efficiency across two breeds (Holstein-Friesian and Charolais) and three dietary phases (high concentrate during both growing and finishing phases and zero-grazed grass during the growing phase). Mitochondrial encoded genes as affected by feed efficiency phenotype across breed and dietary contrast. Genes highlighted in green are downregulated in Low-RFI compared to High-RFI, genes in red are upregulated in Low-RFI compared to High-RFI, with genes unaffected by RFI phenotype highlighted in yellow.
Fig. 7.
Fig. 7.
Mitochondrial and transcription factors co-expression network. Triangles represent transcription factors (TF) and the remaining genes are represented by circles. Red and blue nodes represented mitochondria or nucleus encoded genes, respectively, purple nodes indicate TF that are also mitochondrial genes and green nodes indicate additional TFs. Influential nuclear hormone receptors are highlighted.

Similar articles

References

    1. Alexandre, P. A., Naval-Sanchez, M., Porto-Neto, L. R., Ferraz, J. B. S., Reverter, A. and Fukumasu, H. (2019). Systems biology reveals NR2F6 and TGFB1 as key regulators of feed efficiency in beef cattle. Front. Genet. 10, 230. 10.3389/fgene.2019.00230 - DOI - PMC - PubMed
    1. Andrews, S. (2010). FastQC: A quality control tool for high throughput sequence data. [cited 2023]. Available from: http://www.bioinformatics.babraham.ac.uk/projects/fastqc/
    1. Assenov, Y., Ramirez, F., Schelhorn, S. E., Lengauer, T. and Albrecht, M. (2008). Computing topological parameters of biological networks. Bioinformatics 24, 282-284. 10.1093/bioinformatics/btm554 - DOI - PubMed
    1. Banerjee, P., Diniz, W. J. S., Rodning, S. P. and Dyce, P. W. (2023). miRNA expression profiles of peripheral white blood cells from beef heifers with varying reproductive potential. Front. Genet. 14, 1174145. 10.3389/fgene.2023.1174145 - DOI - PMC - PubMed
    1. Barth, E., Stammler, G., Speiser, B. and Schaper, J. (1992). Ultrastructural quantitation of mitochondria and myofilaments in cardiac muscle from 10 different animal species including man. J. Mol. Cell. Cardiol. 24, 669-681. 10.1016/0022-2828(92)93381-s - DOI - PubMed

Substances