. 2025 Jan 30;135(6):e184243.
doi: 10.1172/JCI184243.

Transcription of hepatitis B surface antigen shifts from cccDNA to integrated HBV DNA during treatment

Affiliations

Transcription of hepatitis B surface antigen shifts from cccDNA to integrated HBV DNA during treatment

Maraake Taddese et al. J Clin Invest. .

Abstract

The cornerstone of functional cure for chronic hepatitis B (CHB) is hepatitis B surface antigen (HBsAg) loss from blood. HBsAg is encoded by covalently closed circular DNA (cccDNA) and HBV DNA integrated into the host genome (iDNA). Nucleos(t)ide analogs (NUCs), the mainstay of CHB treatment, rarely lead to HBsAg loss, which we hypothesized was due to continued iDNA transcription despite decreased cccDNA transcription. To test this, we applied a multiplex droplet digital PCR that identifies the dominant source of HBsAg mRNAs to 3,436 single cells from paired liver biopsies obtained from 10 people with CHB and HIV receiving NUCs. With increased NUC duration, cells producing HBsAg mRNAs shifted their transcription from chiefly cccDNA to chiefly iDNA. This shift was due to both a reduction in the number of cccDNA-containing cells and diminished cccDNA-derived transcription per cell; furthermore, it correlated with reduced detection of proteins deriving from cccDNA but not iDNA. Despite this shift in the primary source of HBsAg, rare cells remained with detectable cccDNA-derived transcription, suggesting a source for maintaining the replication cycle. Functional cure must address both iDNA and residual cccDNA transcription. Further research is required to understand the significance of HBsAg when chiefly derived from iDNA.

Keywords: Hepatitis; Infectious disease; Transcription; Virology.


Figures

Figure 1
Figure 1. Transcriptional map with human-virus chimeric breakpoints from liver tissue.
Horizontal lines depict the 4 canonical HBV mRNAs produced by each of the open reading frames. The variable chimeric virus-host regions are displayed as hashed lines at the 3′ end of transcripts. Solid vertical lines show the positions of DR2, DR1, and the canonical polyadenylation signal (PAS), respectively. The colored bars depict the 2 ddPCR target amplicons: mid-HBV and 3′-HBV. The locations of the HBV enhancer II (EnhII) and core promoter regions are displayed as green and orange boxes, respectively. The dashed line represents the EcoRI cut site, which is included for reference.
Figure 2
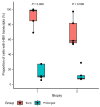
Figure 2. Lower proportion of cells with HBV transcripts with prolonged NUC treatment.
The proportion of all analyzed cells with detectable transcripts (positive for mid-HBV, 3′-HBV, or both) in each biopsy is shown; each dot represents a person at their respective biopsies. The boxes span the first and third quartiles with a horizontal line representing the median. The tails correspond to the minimum and maximum of that respective group. Wilcoxon’s rank-sum test was used to compare between groups. Red, early group; blue, prolonged group.
Figure 3
Figure 3. Changes in the cellular source of HBV transcription in paired biopsies during early and prolonged NUC treatment.
Shown are the proportion of hepatocytes that are transcriptionally active (i.e., contain viral transcripts). The larger circles, outlined in black, are fixed in size. The inner inscribed pie charts depict the proportion of hepatocytes that were found to be transcriptionally active. When the inner pie chart fills the entire larger circle, it indicates that 100% of hepatocytes are transcriptionally active, whereas smaller proportions are denoted by their respective areas. Each pie chart is subdivided by color to indicate the proportion of transcriptionally active cells that have either chiefly cccDNA-derived transcription (red), chiefly iDNA-derived transcription (blue), or mixed transcription (purple). HBeAg status (positive or negative) at the time of each biopsy is indicated to the right of each circle. Participants are ordered from top to bottom by the duration of NUC therapy prior to biopsy 1, as indicated by the vertical gray wedges to the left of all participants. P values for each change are shown in Supplemental Table 1. HB11* indicates the individual who seroconverted HBeAg between biopsies.
Figure 4
Figure 4. Among cells actively transcribing viral RNA there are different decay rates depending on the transcriptional source.
Each gray line represents a participant, with points corresponding to biopsies 1 and 2. The time on NUCs (years) is plotted against the proportion of cells actively transcribing S chiefly from cccDNA (iDNA-TI ≤ 1) (A), from both cccDNA and iDNA (iDNA-TI > 1) (B), and chiefly from iDNA (only mid-HBV positive) (C). Mixed-effects modeling was used to generate rates across the group, represented by the black lines (see Methods).
Figure 5
Figure 5. cccDNA-derived transcription drives intrahepatic viral antigen production early after NUCs but not after prolonged NUCs.
Immunohistochemistry was used to stain for hepatitis B core antigen (HBcAg) and hepatitis B surface antigen (HBsAg) in each biopsy, and the amount of staining was quantified by a pathologist who was blinded to participant identity. (A) Representative HBcAg (left) and HBsAg (right) staining images at biopsy 1 for 1 participant in the early treatment group, HB6 (top), and 1 in the prolonged group, HB12 (bottom). Original magnification, ×200 (top images) and ×100 (bottom images). (B) After stratifying by HBcAg-positive biopsies (top) and HBcAg-negative biopsies (bottom), we correlated the percentage of transcriptionally active cells with cccDNA-derived transcripts (including chiefly cccDNA and mixed) with the percentage of cells positive for HBsAg staining. Red and blue dots (biopsy 1) represent early and prolonged individuals, respectively. Spearman’s correlation coefficients and associated P values are shown. Bx, biopsy.
Figure 6
Figure 6. Participants with higher proportions of cells with cccDNA-derived transcription at biopsy 1 had larger declines in blood qHBsAg with NUC treatment.
The y axis represents the maximum decline of qHBsAg after NUCs relative to measures taken at biopsy 1 (Supplemental Figure 2), while the size and color of the points indicate the proportion of all cells with any cccDNA transcription (including chiefly cccDNA and mixed) at biopsy 1. The boxes span the first and third quartiles, and the horizontal lines represent the median. The tails correspond to the minimum and maximum of that respective group. Wilcoxon’s rank-sum test was used to compare qHBsAg declines between early and prolonged groups.

Similar articles

Cited by

References

    1. Ghany MG, et al. Guidance on treatment endpoints and study design for clinical trials aiming to achieve cure in chronic hepatitis B and D: Report from the 2022 AASLD-EASL HBV-HDV Treatment Endpoints Conference. Hepatology. 2023;78(5):1654–1673. doi: 10.1097/HEP.0000000000000431. - DOI - PubMed
    1. Grudda T, et al. Integrated hepatitis B virus DNA maintains surface antigen production during antiviral treatment. J Clin Invest. 2022;132(18):e161818. doi: 10.1172/JCI161818. - DOI - PMC - PubMed
    1. Meier MA, et al. Ubiquitous expression of HBsAg from integrated HBV DNA in patients with low viral load. J Hepatol. 2021;75(4):840–847. doi: 10.1016/j.jhep.2021.04.051. - DOI - PubMed
    1. Wooddell CI, et al. RNAi-based treatment of chronically infected patients and chimpanzees reveals that integrated hepatitis B virus DNA is a source of HBsAg. Sci Transl Med. 2017;9(409):eaan0241. doi: 10.1126/scitranslmed.aan0241. - DOI - PMC - PubMed
    1. Balagopal A, et al. Single hepatocyte hepatitis B virus transcriptional landscape in HIV coinfection. J Infect Dis. 2020;221(9):1462–1469. doi: 10.1093/infdis/jiz607. - DOI - PMC - PubMed