. 2025 Feb 3;66(2):2.
doi: 10.1167/iovs.66.2.2.

Lamp2 Deficiency Enhances Susceptibility to Oxidative Stress-Induced RPE Degeneration

Affiliations

Lamp2 Deficiency Enhances Susceptibility to Oxidative Stress-Induced RPE Degeneration

Guannan Wu et al. Invest Ophthalmol Vis Sci. .

Abstract

Purpose: Autophagy and lysosomal degradation are vital processes that protect cells from oxidative stress. This study investigated the role of lysosome-associated membrane protein 2 (Lamp2), a lysosomal protein essential for autophagosome maturation and lysosome biogenesis, in maintaining retinal health under oxidative stress.

Methods: To induce oxidative stress, young Lamp2 knockout (KO) and wild-type mice received an intravenous injection of a low dose (10 mg/kg) of sodium iodate (NaIO3). We examined retinal histopathology and morphological changes in the RPE. The involvement of resident microglia or infiltrating macrophages was assessed using immunostaining, flow cytometry, and real-time PCR for chemokines and cytokines.

Results: After administering a low-dose NaIO3, Lamp2 KO mice showed significant RPE degeneration, whereas wild-type mice had minimal damage. Histological analysis and electron microscopy revealed significant thinning of the outer nuclear layer and loss of RPE epithelial polarity in Lamp2 KO mice. Additionally, there was a significant increase in ionized calcium-binding adaptor molecule 1-positive microglia and macrophages in the outer retina. Early proliferation of CD45lowMHC-IIlow resident microglia was followed by the infiltration of CD45highLy6Chigh monocytes and the engraftment of CD11b+CD45high monocyte-derived macrophages. Transcript levels of monocyte chemoattractant protein 1, macrophage inflammatory protein 1β, Il- 1β, and Il-6 also increased in the retinas of Lamp2 KO mice. Furthermore, pretreatment with the macrophage-depleting agent clodronate prevented NaIO3-induced RPE degeneration and macrophage infiltration in Lamp2 KO mice.

Conclusions: Lamp2 deficiency, when combined with oxidative stress, leads to RPE degeneration in vivo. Lysosomal dysfunction also promotes macrophage engraftment and triggers neurotoxic inflammation.


Conflict of interest statement

Disclosure: G. Wu, None; S. Notomi, None; Z. Xu, None; Y. Fukuda, None; Y. Maehara, None; Y. Tao, None; H. Zhao, None; K. Ishikawa, None; Y. Murakami, None; T. Hisatomi, K.-H. Sonoda, None

Figures

Figure 1.
Figure 1.
Transcriptional changes in antioxidant genes in the retina and RPE from Lamp2 KO and WT mice following low-dose NaIO3 injections. Quantitative PCR analysis of Gpx4, Nrf2, and Sod1 in the retina (A) and RPE (B) of WT and Lamp2 KO mice with or without NaIO3 treatment. Data are represented as mean ± SD; n = 6 eyes per time point. One-way ANOVA followed by Tukey's post hoc test. *P < 0.05, **P < 0.01, ***P < 0.001.
Figure 2.
Figure 2.
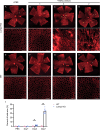
Effect of low-dose NaIO3 on RPE morphology in WT and Lamp2 KO mice. (A–H) Representative images of the RPE/choroid flat-mount labeled with ZO-1 (red) and the RPE degeneration area over time after injection of NaIO3, n > 4 for each group. Edges of the degeneration area are highlighted by yellow arrows. Scale bars, 200 µm. (A–H) Higher magnification images of RPE degeneration are shown in the lower panels. Scale bars, 50 µm. (A, E) RPE/choroid flat-mount from WT and Lamp2 KO mice with PBS control showed no apparent morphological changes in the RPE. Lamp2 KO mice with systemic injection of 10 mg/kg NaIO3 showed RPE degeneration from day 3 (C) and aggravated on day 7 (D), whereas WT mice with the same injection did not show any RPE degeneration (F–H). (I) Quantification of the RPE degeneration area indicated that 34% of the RPE was degenerated in Lamp2 KO mice. Proportions of RPE degeneration area are expressed as mean ± SD (n = 4–8 eyes per group). Student t tests. *P < 0.05, ** P < 0.01, ***P < 0.001.
Figure 3.
Figure 3.
Ultrastructural changes and histopathology of the retinas from Lamp2 KO and WT mice treated with low-dose NaIO3. (A) Representative transmission electron microscopy images of the RPE from Lamp2 KO and WT mice following 7 days of NaIO3 injection. The RPE cells from Lamp2 KO mice did not have normal structures of basal infoldings and apical microvilli and showed numerous vacuolizations in the cytoplasm. With a loss of epithelial polarity, a stratification was observed; see the nuclei of overlying RPE (asterisk). Disruption of mitochondrial cristae structures was observed in NaIO3-treated Lamp2 KO mice (arrows), whereas those of WT mice were preserved (arrowheads). Scale bars in the left panel are 5 µm and the right panel are 2 µm. (B) hematoxylin and eosin staining of cross-sections in Lamp2 KO mice showed a slight decrease in ONL thickness compared with WT under PBS treatment. After 7 days of NaIO3 injection, the RPE and photoreceptors were severely damaged in Lamp2 KO mice, while no changes were observed in WT. Scale bars, 50 µm. (C) Quantifications for the ONL thickness on day 7 after NaIO3 injections in Lamp2 KO and WT mice. Data are shown as mean ± SD, n = 4 eyes. Student t tests. **P < 0.01. GCL, ganglion cell layer; INL, inner nuclear layer; IPL, inner plexiform layer; OPL, outer plexiform layer.
Figure 4.
Figure 4.
Infiltration of Iba-1–positive cells and associated RPE injury after NaIO3 injections. (A–D) Representative images of Iba-1 (green)-positive cells and RPE morphology stained by ZO-1 (red) in the retinal and RPE/choroid flat-mounts from 3-month-old Lamp2 KO and WT mice treated with NaIO3 or PBS on day 7. RPE/choroid flat-mounts were also stained by ZO-1 (red). (E–H) Quantifications of Iba-1+ cells in different retinal layers. (I) The total number of Iba-1+ cells in all retinal layers. Mean ± SD, n = 4 for the PBS group and 8 for the NaIO3 group. One-way ANOVA followed by Tukey's post hoc test, ** P < 0.01, ***P < 0.001, ****P < 0.0001. GCL, ganglion cell layer; IPL, inner plexiform layer; OPL, outer plexiform layer, PRL, photoreceptor segment layer; SRS, subretinal space. (J) Representative images showing areas of variable RPE degeneration and associated Iba-1+ cells. The outlines of individual RPE cells were sketched using FIJI (lower panels). (K) Correlation between CI of the RPE and the number of Iba-1+ cells was evaluated using linear regression analysis. Scale bars, 50 µm.
Figure 5.
Figure 5.
Flow cytometry analysis of the microglial populations in WT and Lamp2 KO mice after NaIO3 administration. (A) CD45low populations from retinas of WT or Lamp2 KO mice were gated by Ly6C and CX3CR1 expression; MHC-II was used to distinguish microglia from resident macrophages. (B) Among the Ly6C CX3CR1+ population, the number of MHC-IIlow microglia in the retina increased on day 1 or later after NaIO3 injection. Mean ± SD, n = 6 eyes. One-way ANOVA followed by Tukey's post hoc test. *P < 0.05, **P < 0.01, ***P < 0.001.
Figure 6.
Figure 6.
Flow cytometry analysis for the monocyte-derived macrophage populations in WT and Lamp2 KO mice after NaIO3 administration. (A) CD45high populations from retinas of WT or Lamp2 KO mice were gated by Ly6C and CX3CR1 expression; Ly6Chigh population was considered to be monocytes while Ly6Clow population to be monocyte-derived macrophages. (B) Ly6Chigh monocytes and Ly6Clow macrophages increased on day 3 or later. Data are shown as mean ± SD, n = 6 eyes. One-way ANOVA followed by Tukey's post hoc test. *P < 0.05, **P < 0.01.
Figure 7.
Figure 7.
Transcriptional levels of the chemokines and cytokines in the retina of WT and Lamp2 KO mice following NaIO3 treatment. The mRNA levels of Mcp-1, Mip-1β, Il-1β, and Il-6 were evaluated 1 and 3 days after the NaIO3 injection. The expression of Mcp-1 and Mip-1β transcripts in the retina of Lamp2 KO mice increased significantly on day 1, and Il-1β and Il-6 increased on day 3, whereas there were no changes in WT mice. Data are shown as mean ± SD, n = 6 eyes. One-way ANOVA followed by Tukey's post hoc test. *P < 0.05, **P < 0.01.
Figure 8.
Figure 8.
The effect of the macrophage-depleting agent clodronate in the retinal degeneration induced by NaIO3 in Lamp2 KO mice. Representative images of retina and RPE/choroid flat-mounts stained with Iba-1 (green) and ZO-1 (red), along with hematoxylin and eosin–stained cross-sections, from PBS control and clodronate injection groups in Lamp2 KO mice 7 days after NaIO3 treatment. (A–F) Clodronate treatment reduced Iba-1+ cells in the retinal layers of Lamp2 KO mice after NaIO3 injection. Scale bars, 50 µm. (G) Moreover, The RPE degeneration area was significantly reduced by clodronate treatment. Scale bars, 200 µm/50 µm. (H) Quantification of the RPE degeneration resulted in an 83% decrease by clodronate treatment. Data are shown as mean ± SD, n = 4 eyes. Student t test. (I) Hematoxylin and eosin staining revealed depletion of macrophages using clodronate mitigated NaIO3-induced ONL thinning. Scale bars, 50 µm. (J) Thickness of the ONL on day 7 after NaIO3 injections in Lamp2 KO mice. Data are shown as mean ± SD, n = 6 eyes. Student t test. **P < 0.01, ***P < 0.001. GCL, ganglion cell layer; IPL, inner plexiform layer; OPL, outer plexiform layer, PRL, photoreceptor segment layer; SRS, subretinal space.

Similar articles

Cited by

References

    1. Levine B, Kroemer G.. Biological functions of autophagy genes: a disease perspective. Cell. 2019; 176: 11–42. - PMC - PubMed
    1. Levine B, Kroemer G.. Autophagy in the pathogenesis of disease. Cell. 2008; 132: 27–42. - PMC - PubMed
    1. Kim JY, Zhao H, Martinez J, et al. .. Noncanonical autophagy promotes the visual cycle. Cell. 2013; 154: 365–376. - PMC - PubMed
    1. Boya P, Kaarniranta K, Handa JT, Sinha D.. Lysosomes in retinal health and disease. Trends Neurosci. 2023; 46: 1067–1082. - PMC - PubMed
    1. Pan C, Banerjee K, Lehmann GL, et al. .. Lipofuscin causes atypical necroptosis through lysosomal membrane permeabilization. Proc Natl Acad Sci USA. 2021; 118: e2100122118. - PMC - PubMed

MeSH terms

LinkOut - more resources