

Requirements for fast multianalyte detection and characterisation via electrochemical-assisted SERS in a reusable and easily manufactured flow cell
- PMID: 39899114
- PMCID: PMC11914304
- DOI: 10.1007/s00216-025-05763-w
Requirements for fast multianalyte detection and characterisation via electrochemical-assisted SERS in a reusable and easily manufactured flow cell
Abstract
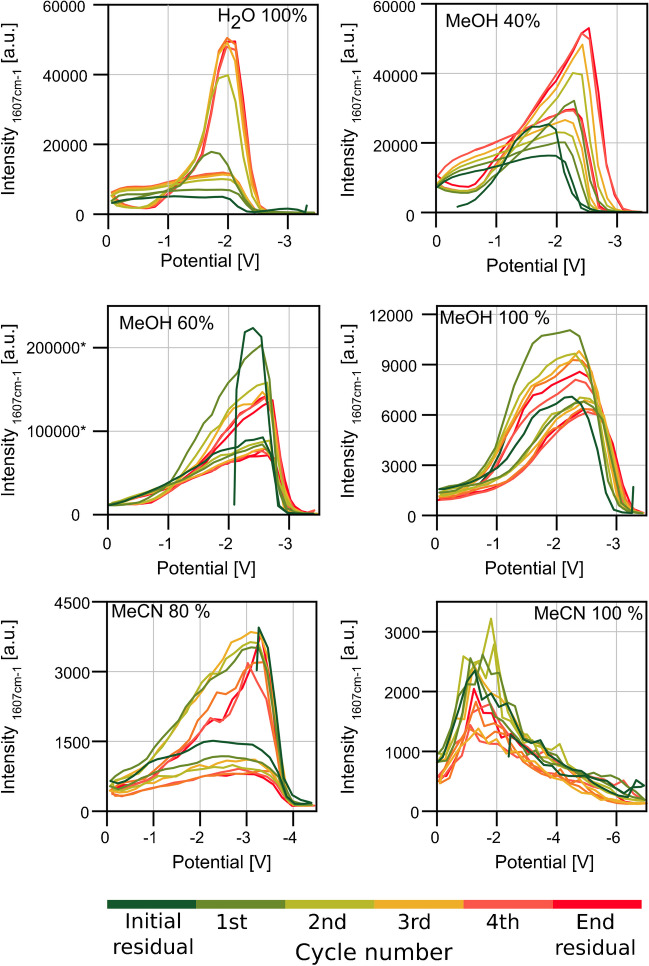
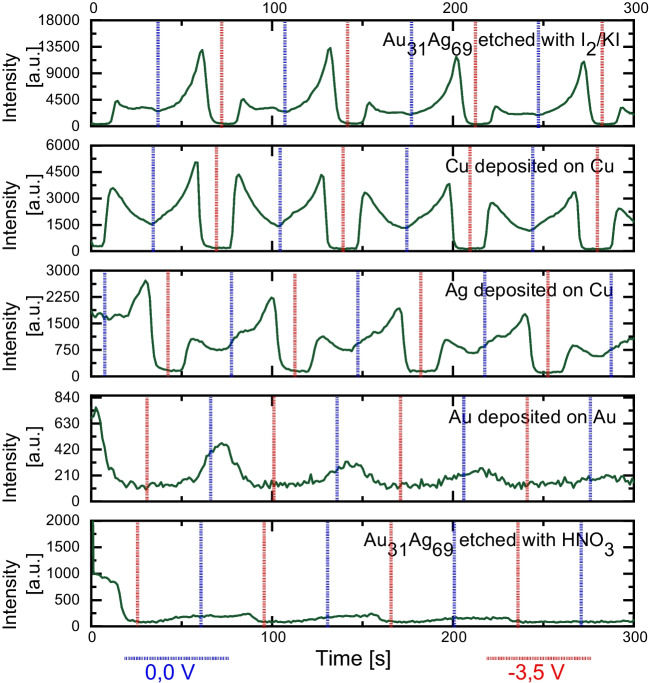
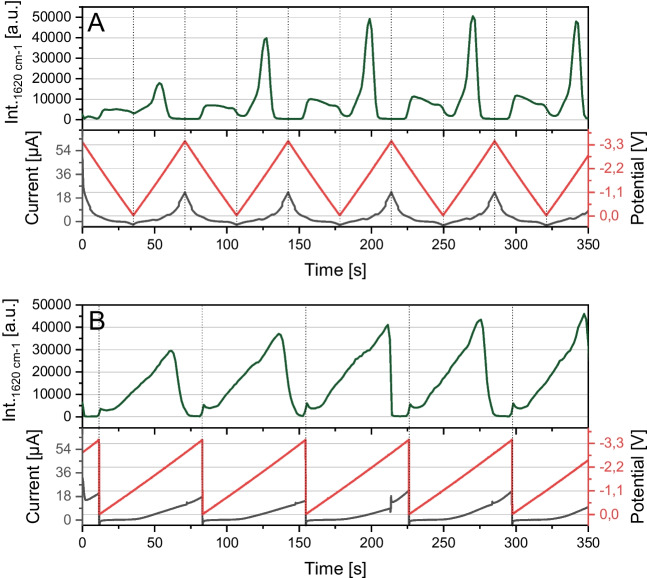
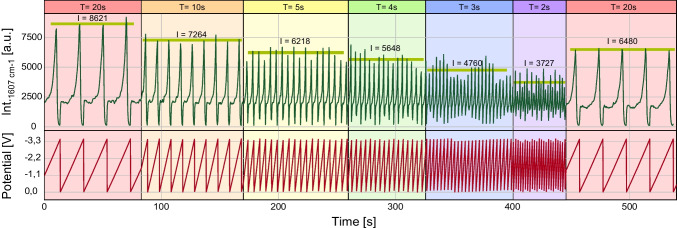
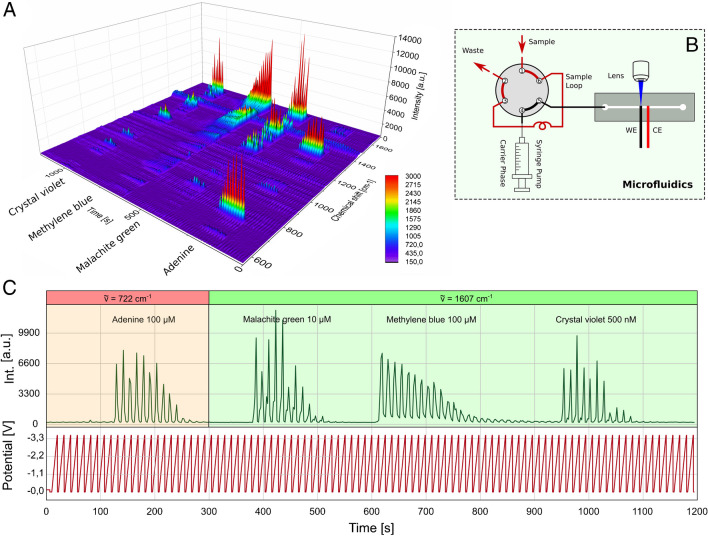
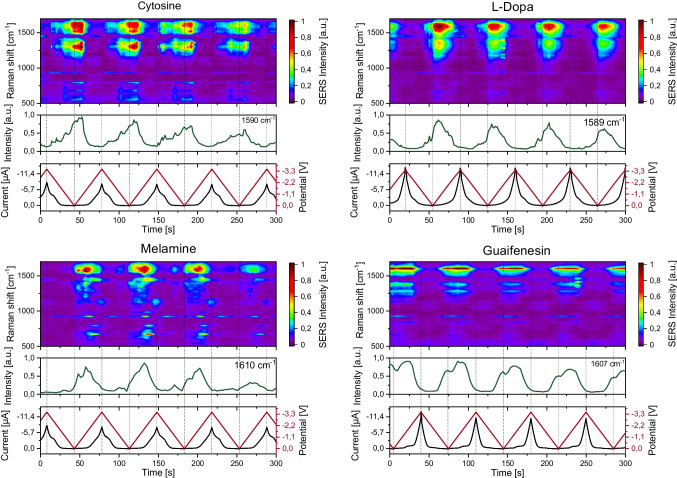
Surface-enhanced Raman spectroscopy (SERS) is a highly sensitive analytical technique that captures vibrational spectra of analytes adsorbed to rough coin metal surfaces with remarkable signal intensities. However, its wider application is limited by challenges in substrate range, quantification, and the disposable nature of SERS substrates partly due to irreversible analyte adsorption-commonly referred to as the 'memory effect'. Overcoming these limitations and achieving real-time analysis in flow-through systems remains a key challenge for the advancement of SERS. This study presents a SERS flow cell incorporating an Ag-based SERS substrate and a Pt counter-electrode, enabling the investigation of how electrochemical methods can address existing challenges. Our approach demonstrates that signal intensities can be both enhanced and spectroelectrochemically modified. Additionally, the combination of constant solvent flow and electrochemical potentials enhances the longevity of the SERS substrate, facilitating multianalyte measurements while mitigating the memory effect. Key parameters have been systematically studied, including SERS substrate materials (silver and copper), solvents, buffers, supporting electrolytes, and electrochemical protocols. We achieved consistent and reproducible electrochemical tuning of SERS signals by using halogen-free electrolytes in polar solvents commonly used in techniques like HPLC. The versatility of the system was validated through the analysis of several model compounds and the sequential detection of multiple analytes. We also successfully applied the system to detect and characterise contaminants and pharmaceuticals, highlighting its potential for a wide range of analytical applications.
Keywords: Electrochemical SERS; Flow cell; HPLC; SERS substrates; Surface-enhanced Raman spectroscopy.
© 2025. The Author(s).
Conflict of interest statement
Declarations. Conflict of interest: The authors have no conflicts of interest to declare. All co-authors have seen and agree with the manuscript’s contents, and there is no financial interest to report. We certify that the submission is original work and is not under review at any other publication.
Figures
Similar articles
-
In situ laser-induced photochemical silver substrate synthesis and sequential SERS detection in a flow cell.Anal Bioanal Chem. 2011 May;400(3):815-20. doi: 10.1007/s00216-011-4798-5. Epub 2011 Feb 26. Anal Bioanal Chem. 2011. PMID: 21359570
-
Highly reproducible SERS detection in sequential injection analysis: real time preparation and application of photo-reduced silver substrate in a moving flow-cell.Talanta. 2013 Nov 15;116:972-7. doi: 10.1016/j.talanta.2013.07.059. Epub 2013 Jul 31. Talanta. 2013. PMID: 24148503
-
Advancements in reusable SERS substrates for trace analysis applications.Talanta. 2024 Nov 1;279:126640. doi: 10.1016/j.talanta.2024.126640. Epub 2024 Jul 31. Talanta. 2024. PMID: 39128272 Review.
-
Potential-modulated SERS profiling via GLAD-fabricated Ag nanorod arrays for ultrasensitive and label-free spectroelectrochemical sensing.Nanoscale. 2025 Jun 5;17(22):13915-13928. doi: 10.1039/d5nr01491c. Nanoscale. 2025. PMID: 40402131
-
Surface-enhanced Raman spectroscopy: substrate-related issues.Anal Bioanal Chem. 2009 Aug;394(7):1729-45. doi: 10.1007/s00216-009-2761-5. Epub 2009 Apr 19. Anal Bioanal Chem. 2009. PMID: 19381618 Review.
Cited by
-
A Microfluidic Device to Realize Electrochemically Controlled SERS Detection in HPLC.Anal Chem. 2025 Jul 1;97(25):13628-13636. doi: 10.1021/acs.analchem.5c02232. Epub 2025 Jun 23. Anal Chem. 2025. PMID: 40545866 Free PMC article.
References
-
- Aroca RF, Alvarez-Puebla RA, Pieczonka N, Sanchez-Cortez S, Garcia-Ramos JV. Surface-enhanced Raman scattering on colloidal nanostructures. Adv Coll Interface Sci. 2005. 10.1016/j.cis.2005.04.007. - PubMed
-
- Cheng C, Yan B, Wong SM, Li X, Zhou W, Yu T, Shen Z, Yu H, Fan HJ. Fabrication and SERS performance of silver-nanoparticle-decorated Si/ZnO nanotrees in ordered arrays. ACS Appl Mater Interfaces. 2010. 10.1021/am100270b. - PubMed
-
- Ko H, Tsukruk VV. Nanoparticle-decorated nanocanals for surface-enhanced Raman scattering. Small. 2008. 10.1002/smll.200800301. - PubMed
-
- Moldovan R, Vereshchagina E, Milenko K, Iacob B-C, Bodoki AE, Falamas A, Tosa N, Muntean CM, Farcău C, Bodoki E. Review on combining surface-enhanced Raman spectroscopy and electrochemistry for analytical applications. Anal Chim Acta. 2021. 10.1016/j.aca.2021.339250. - PubMed
Grants and funding
LinkOut - more resources
Full Text Sources
Miscellaneous
