Development of a prognostic model based on four genes related to exhausted CD8+ T cell in triple-negative breast cancer patients: a comprehensive analysis integrating scRNA-seq and bulk RNA-seq
- PMID: 39899181
- PMCID: PMC11790537
- DOI: 10.1007/s12672-025-01812-z
Development of a prognostic model based on four genes related to exhausted CD8+ T cell in triple-negative breast cancer patients: a comprehensive analysis integrating scRNA-seq and bulk RNA-seq
Abstract
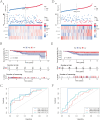
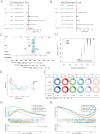
Low immune infiltration is closely associated with poor clinical results and an unfavorable response to therapy in triple-negative breast cancer (TNBC). T-cell exhaustion (TEX) is a significant risk factor for tumor immunosuppression and invasion. Although improving TEX and enhancing effector function are promising strategies for strengthening immunotherapy, their role in the pathogenesis of TNBC remains unclear. This study's objective was to develop a prognostic model for TNBC based on exhausted CD8+ T-cell (CD8+ Tex)-related differentially expressed genes (DEGs) and to investigate its clinical and immune relevance. Initially, 398 CD8+ Tex-related genes were screened utilizing single-cell RNA sequencing (scRNA-seq) data from TNBC patients. Pseudotime analysis confirmed that CD8+ Tex mainly clustered at the end of the differentiation pathways, making them a critical subset in TNBC progression. By analyzing the TCGA cohort, ten CD8+ Tex-related DEGs were identified as significantly correlated with overall survival (OS) in TNBC patients, and a prognostic model containing four biomarkers (GBP1, CTSD, ABHD14B, and HLA-A) was constructed. The model demonstrated robust predictive capability in both the TCGA cohort and an external cohort, with the low-risk group exhibiting elevated expression of immunological checkpoint molecules and immune cell infiltration, as well as better responses to immunotherapy and chemotherapy. Furthermore, these four biomarkers were found to be highly expressed on CD8+ Tex and were associated with cellular communication efficiency. Therefore, this model is expected to be a new method for forecasting TNBC patients' prognosis and effectiveness of treatment, providing new insights for clinical decision-making.
Keywords: Cellular communication; Exhausted CD8+ T cell; Single-cell RNA sequencing; Triple-negative breast cancer; Tumor immune microenvironment.
© 2025. The Author(s).
Conflict of interest statement
Declarations. Competing interests: The authors declare no competing interests.
Figures


Similar articles
-
Identification of the CD8+ T-cell exhaustion signature of hepatocellular carcinoma for the prediction of prognosis and immune microenvironment by integrated analysis of bulk- and single-cell RNA sequencing data.Transl Cancer Res. 2024 Nov 30;13(11):5856-5872. doi: 10.21037/tcr-24-650. Epub 2024 Nov 20. Transl Cancer Res. 2024. PMID: 39697729 Free PMC article.
-
Integrated analysis of single-cell RNA-seq and bulk RNA-seq unravels T cell-related prognostic risk model and tumor immune microenvironment modulation in triple-negative breast cancer.Comput Biol Med. 2023 Jul;161:107066. doi: 10.1016/j.compbiomed.2023.107066. Epub 2023 May 27. Comput Biol Med. 2023. PMID: 37263064
-
Single-cell atlas reveals a distinct immune profile fostered by T cell-B cell crosstalk in triple negative breast cancer.Cancer Commun (Lond). 2023 Jun;43(6):661-684. doi: 10.1002/cac2.12429. Epub 2023 May 9. Cancer Commun (Lond). 2023. PMID: 37158690 Free PMC article.
-
Comprehensive single-cell analysis of triple-negative breast cancer based on cDC1 immune-related genes: prognostic model construction and immunotherapy potential.Discov Oncol. 2025 Feb 19;16(1):206. doi: 10.1007/s12672-025-01929-1. Discov Oncol. 2025. PMID: 39969635 Free PMC article.
-
CD8+ T-cell exhaustion: Impediment to triple-negative breast cancer (TNBC) immunotherapy.Biochim Biophys Acta Rev Cancer. 2024 Nov;1879(6):189193. doi: 10.1016/j.bbcan.2024.189193. Epub 2024 Oct 15. Biochim Biophys Acta Rev Cancer. 2024. PMID: 39413858 Review.
References
-
- Nolan E, Lindeman GJ, Visvader JE. Deciphering breast cancer: from biology to the clinic. Cell. 2023;186:1708–28. 10.1016/j.cell.2023.01.040. - PubMed
-
- Harris MA, Savas P, Virassamy B, O’Malley MMR, Kay J, Mueller SN, Mackay LK, Salgado R, Loi S. Towards targeting the breast cancer immune microenvironment. Nat Rev Cancer. 2024;24:554–77. 10.1038/s41568-024-00714-6. - PubMed
Grants and funding
- tstp20221166/Shandong Provincial Taishan Scholar Special Appointed Expert Talent Program
- 82430123/the National Natural Science Foundation of China Key Project: Biomechanical Study on the Regulation of Tumor-Associated Fibroblasts by the Method of Softening Hardness and Dispersing Mass to Inhibit Breast Cancer Metastasis
LinkOut - more resources
Full Text Sources
Research Materials
Miscellaneous
