Visceral obesity augments prescription use: An analysis of the cross-sectional study of NHANES 2011-2018
- PMID: 39899523
- PMCID: PMC11790123
- DOI: 10.1371/journal.pone.0318413
Visceral obesity augments prescription use: An analysis of the cross-sectional study of NHANES 2011-2018
Abstract
Background: Visceral obesity (VATob) increases the risk for many diseases. Central obesity has been associated with an augmented prescription use; however, there is a paucity of research focused on VATob. Here, the aim was to evaluate the association between VATob and prescription use.
Methods: Data was collected from the NHANES dataset (2011-2018). Visceral adipose tissue was measured using dual x-ray absorptiometry, and VATob was defined as ≥100 cm2. Prescription use was collected from the RXQ_RX files and classified according to Vademecum. Association between VATob and prescription use was determined with logistic regression and reported as odds ratios (ORs) with 95% confidence intervals (95%CIs).
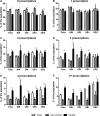
Results: 10,952 participants (weighted: 121,090,702) were included, in which 41.8% were VATob and 52.0% of them had ≥1 prescription. Overall, VATob demonstrated an augmented rate of prescription use when compared to non-VATob (52.0% versus 36.7%, p<0.001), specifically with metabolic (4.5-fold increase), cardiovascular (3.9-fold increase), gastrointestinal (2.5-fold increase), and hematopoietic agents (2.3-fold increase). This was associated with increased the risk for overall prescription use (ORoverall = 1.9, 95%CI: 1.7-2.1, p<0.001). Similar results were observed with metabolic and cardiovascular agents. However, when stratified by BMI, normal weight participants (ORmetabolic = 10.4; 95%CI: 6.5-16.6 & ORcardiovascular = 7.0; 95%CI: 4.4-11.1, p<0.001) had a greater risk than the overweight (ORmetabolic = 4.1; 95%CI: 3.0-5.6 & ORcardiovascular = 3.4; 95%CI: 2.5-4.7, p<0.001) or obese participants (ORmetabolic = 3.5; 95%CI: 2.3-5.3 & ORcardiovascular = 3.5; 95%CI: 2.5-4.9, p<0.001).
Conclusion: VATob is associated with augmented prescription use, particularly with cardiovascular and metabolic agents. This association was higher for normal weight participants.
Copyright: © 2025 Acevedo-Fernández et al. This is an open access article distributed under the terms of the Creative Commons Attribution License, which permits unrestricted use, distribution, and reproduction in any medium, provided the original author and source are credited.
Conflict of interest statement
Authors declare no competing interest.
Figures


Similar articles
-
Visceral and subcutaneous abdominal fat is associated with non-alcoholic fatty liver disease while augmenting Metabolic Syndrome's effect on non-alcoholic fatty liver disease: A cross-sectional study of NHANES 2017-2018.PLoS One. 2024 Feb 23;19(2):e0298662. doi: 10.1371/journal.pone.0298662. eCollection 2024. PLoS One. 2024. PMID: 38394065 Free PMC article.
-
Visceral adiposity and inflammatory bowel disease.Int J Colorectal Dis. 2021 Nov;36(11):2305-2319. doi: 10.1007/s00384-021-03968-w. Epub 2021 Jun 9. Int J Colorectal Dis. 2021. PMID: 34104989 Review.
-
Association between Blood Manganese Levels and Visceral Adipose Tissue in the United States: A Population-Based Study.Nutrients. 2022 Nov 11;14(22):4770. doi: 10.3390/nu14224770. Nutrients. 2022. PMID: 36432456 Free PMC article.
-
Association between visceral adiposity index, lipid accumulation product and type 2 diabetes mellitus in US adults with hypertension: a cross-sectional analysis of NHANES from 2005 to 2018.BMC Endocr Disord. 2024 Oct 15;24(1):216. doi: 10.1186/s12902-024-01750-x. BMC Endocr Disord. 2024. PMID: 39407231 Free PMC article.
-
Association between visceral adipose tissue area and infertility: a cross-sectional analysis.Reprod Biomed Online. 2024 Sep;49(3):104099. doi: 10.1016/j.rbmo.2024.104099. Epub 2024 May 3. Reprod Biomed Online. 2024. PMID: 38889591
References
-
- Statista. Total number of medical prescriptions dispensed in the U.S. from 2009 to 2022 2022 Available from: https://www.statista.com/statistics/238702/us-total-medical-prescription.... [Accessed 12 Jun. 2023].
-
- Foundation PGP. How Have Prescription Drug Prices Changed Over Time? 2022 Available from: https://www.pgpf.org/blog/2022/04/how-have-prescription-drug-prices-chan.... [Accessed 12 Jun. 2023].
MeSH terms
LinkOut - more resources
Full Text Sources

