. 2025 Feb 3;20(2):e0315747.
doi: 10.1371/journal.pone.0315747. eCollection 2025.

Human-environment interaction during the Holocene in Eastern South America: Rapid climate changes and population dynamics

Affiliations

Human-environment interaction during the Holocene in Eastern South America: Rapid climate changes and population dynamics

Astolfo G M Araujo et al. PLoS One. .

Abstract

About 15 years ago, we suggested that the low frequency of archaeological sites dating from the mid-Holocene in several regions of Lowland South America (which was then called the "Archaic Gap") was due to an increase in the magnitude of dry periods related to the mid-Holocene hypsithermal. Since then, data regarding paleoenvironmental reconstructions for this vast area, coupled with an increase in the archaeological knowledge, allow us to reassess the idea of the "Archaic Gap" and redefine both the spatial extent of the phenomenon and its possible causes. Our present analysis aims to present a broader picture of the relations between humans and the environment in Eastern South America since the Late Pleistocene. The obtained results suggest that the extent of the areas that were somewhat depopulated during the mid-Holocene is larger than previously thought; not only Central Brazil, but parts of the Amazon and the Pantanal (close to the Bolivian border) seem to show the same pattern. However, as expected when larger datasets are available, it is possible to perceive oscillations in the archaeological signal that suggest reoccupation of some areas. Although we maintain that the main reasons underlying these patterns are related to climate, they are most probably related to an increase in climatic variability, and not necessarily to an increase in dryness. These observations are of interest to the current debate about the effects of the global warming on human populations.


Conflict of interest statement

The authors have declared that no competing interests exist.

Figures
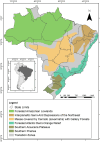
Fig 1
Fig 1. Environmental domains in Eastern South America, after Ab’Sáber (2007).
Fig 2
Fig 2. Spatial distribution of dated sites and main extant biomes.
Fig 3
Fig 3. Extant biomes and paleoenvironmental studies in Eastern South America.
Biomes: Amazonian Rainforest; Caatinga (xeric schrublands); Cerrado (savannahs); Atlantic Rainforest; Pampa (grasslands), and Pantanal (seasonal wetlands). Paleoenvironmental studies: 1)Caracanã Lake; 2) Hill Six Lakes; 3) Pata Lake; 4) Calado Lake; 5) Campos Humaitá; 6 and 7) Carajás; 8) Comprido Lake; 9) Curuá river; 10) Geral Lake; 11) Curuaí Lake; 12) Saci Lake; 13) Curuçá Lake; 14) Paraiso Cave;15) Santa Maria Lake; 16) Saracuri Lake; 17) Tapajós Lake; 18) Tapera Lake; 19) Caçó Lake; 20) Barreirinhas; 21) Sete Cidades; 22) Araripe soils 1; 23) Serra Maranguape; 24) Rio Grande do Norte caves; 25) Chapada do Apodi; 26) Boqueirão Lake; 27 and 28) Guaribas; 29) Arararipe soils 2; 30) Catimbau; 31) Salitre travertines; 32) Icatu dunes; 33) Paixão Cave; 34) Diva de Maura Cave; 35) Confusão Lake; 36) Pau D´Alho Cave; 37) Chaplin Lake (Bolivia); 38) Bella Vista Lake (Bolivia); 39) Ariquemes soils; 40) Pimenta Bueno soils; 41) Vilhena soils; 42) São Bernardo Cave; 43) Angelica Cave; 44)São Mateus Cave; 45) Cromínia swamp; 46) Feia Lake; 47) Olhos Lake; 48) Lagoa Santa; 49) Lapa Grande Cave; 50) Pandeiros Swamp; 51) Pinheiro swamp; 52) Pau de Fruta swamp; 53) Serra da Doida peat bog; 54) Rio Preto swamp; 55) Machado soils; 56) Mares Lake; 57) Tamboril Cave; 58) Lapa sem Fim Cave; 59) Juquinha swamp; 60) Salitre Lake; 61) São José swamp; 62) Laçador swamp; 63) Serra Negra Lake; 64) Salitre soils; 65) Nova Lake; 66) Aleixo Lake; 67) Pires Lake; 68) Água Preta Lake; 69) Dom Helvécio Lake; 70) Sooretama; 71) Negra Lake; 72) Castelo Lake; 73) Nabileque; 74) João Arruda Cave; 75) Taquaraçu; 76) Nhecolândia; 77) Bodoquena; 78) Jaraguá Cave; 79) Gaiba Lake (Bolivia); 80) Mandioré Lake (Bolivia); 81) Cáceres Lake; 82) Juréia; 83) Cananéia; 84) Serra da Bocaina; 85) Campos do Jordão; 86) Colônia; 87) Tamanduá river; 88) Santana Cave; 89) Morro de Itapeva; 90) Cabo Frio; 91) Maricá; 92) Serra dos Órgãos; 93) Paraíba do Sul; 94) Serra de Araçatuba; 95) Serra Campos Gerais; 96) Palhoça; 97) Botuverá Cave; 98) Volta Velha; 99) Mirim Lake; 100) São Francisco de Assis; 101) Cambará do Sul; 102) São Francisco de Paula; 103) Patos Lagoon; 104) Ocean Core 7606; 105) Ocean Core 7616; 106) Ocean Core 7620; 107) Águas Emendadas; 108) Mogi Guaçu river; 109) Mina Modelo pond.
Fig 4
Fig 4. Eastern South America divided into areas as discussed in the text.
Fig 5
Fig 5. Summed probability distribution graph of 725 ages for Amazonia.
Fig 6
Fig 6
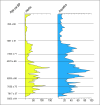
Summed probability distribution graphs for A) Altamira / Oriximiná and B) Santarém. The lower bar graph (C) was modified from Bush et al. 2007 and shows charcoal particles recovered at Geral lake. The stars mark the presence of maize pollen (Zea mays).
Fig 7
Fig 7. Paraiso cave speleothem growth rates.
Speleothem “Par 16” shows a hiatus between ca. 8 and 6 ka BP.
Fig 8
Fig 8. Coefficient of variation for the delta 18O isotopic sequence from Paraiso cave in the last 11 ka BP.
The horizontal solid line represents the mean value (0,019) and the dashed line the mean plus one standard deviation (0,035). We considered values above the dashed line to represent extreme fluctuations.
Fig 9
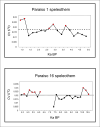
Fig 9. Mean of delta 18O CVs of 250-year time intervals for Paraiso 1(PAR 1) and Paraiso 16 (PAR 16) speleothems.
The dashed horizontal line represents the value of the mean plus one standard deviation. Red dots represent time intervals where the variation was considered extreme.
Fig 10
Fig 10
Summed probability distribution graphs for A) Madeira river area; B) Amazon river area; C) Central Amazonia (Madeira and Amazon river areas together).
Fig 11
Fig 11. Calado lake pollen diagrams for herbs and aquatic plants, modified from Behling et al.
(2001). It can be observed that the most variable period falls between 4 and 6 ka BP. All ages calibrated according to CalPal version 2020.11, INTCAL 2020 curve.
Fig 12
Fig 12. Summed probability distribution graphs for NW Amazonia.
Fig 13
Fig 13. Summed probability distribution graphs for SE Amazonia (including part of Tocantins).
Fig 14
Fig 14. Summed probability graph for SW Amazonia.
Fig 15
Fig 15. Summed probability graph of 463 ages for NE Brazil.
Fig 16
Fig 16. Summed probability graph for the eastern and western portions of NE Brazil.
A) Western: Maranhão and Piaui states, 202 ages. B) Eastern: Rio Grande do Norte, Paraiba, Pernambuco, Ceará, and Alagoas states, 187 ages; C) Southern: Bahia State, 74 ages.
Fig 17
Fig 17. Summed probability graph of 870 ages for Central Brazil.
Ages older than 15 ka BP are not shown.
Fig 18
Fig 18
Summed probability distribution graphs for A) Pantanal; B) Goiás (GO); C) Mato Grosso (MT); D) Mato Grosso do Sul (MS). Ages older than 15 ka BP are not shown.
Fig 19
Fig 19
A) Age distribution for the Pantanal compared with B) the number of pollen taxa for La Gaiba lake (modified from Whitney et al 2014). The lowest number of taxa can be considered as a proxy for the occurrence of extreme climatic events. At 9 ka BP the number of taxa was even lower than during the LGM.
Fig 20
Fig 20. Age distribution for Goiás and peaks of Ti and Fe concentrations (arrows) found at Feia lake (after Cassino et al. 2020).
The Ti and Fe peaks are probably related to events of rhesistasy, when soil erosion / deposition is stronger. Ages calculated for the events are 10.5 ka BP; 9.1 to 8.8 ka BP; 8 to 6.8 ka BP; 6.4 ka BP; and before 4.7 ka BP.
Fig 21
Fig 21. Jaraguá cave.
Plot of delta 18O (orange dots) and delta 13C (blue dots) values across the last 15 ka BP, after Novello et al. (2019). There is a strong correlation among the proxies since 4 ka BP, but a lack of correlation before. Higher values of delta 18O would mean lower precipitation, while higher values of delta 13C would mean less trees. Note that betwwen ca. 12 ka BP and 4 ka BP the proxies suggest less precipitation but more trees.
Fig 22
Fig 22. Jaraguá cave.
Mean coefficients of variation (CVs) in 250 years slots for delta 18O and delta 13C (after Novello et al. 2019). Dashed line marks the mean plus one standard deviation value (0.14) for delta 18O. Intervals above it are interpreted as extreme variations (black arrows).
Fig 23
Fig 23
A) Data from Jaraguá cave (Novello et al. 2019) showing the different natures of sediment input (outside x inside cave) until 3.5 ka BP. Sediments coming from outside are probably signaling disturbances in the vegetational cover (rhesistasy); B) Summed probability age graph for Mato Grosso; C) Summed probability age graph for Mato Grosso do Sul. The shaded bars highlight the match between rhesistatic conditions and the diminution of the archaeological signal. Black arrows indicate the periods where delta 18O shows extreme variability.
Fig 24
Fig 24. Eastern Central Brazil (Minas Gerais state) and the five regions discussed in the text (North Central, Espinhaço, Lagoa Santa, Pains, and Triângulo).
Fig 25
Fig 25
Summed probability distribution graphs for A) Lagoa Santa; B) North/Central MG; C) Espinhaço; D) Pains; E) Triangulo.
Fig 26
Fig 26. Lapa sem Fim speletothem data.
Mean CVs averaged at 250 yr intervals for delta 13C (green line, proxy for vegetation) and delta 18O (red line, proxy for precipitation). Dashed lines show the value of the mean plus one standard deviation for each proxy. Note the peak of vegetation variability ca. 8 ka BP, not followed by precipitation. The opposite trend occurs at ca. 6 to 5.75 ka BP, when a high variability on precipitation is not followed by a vegetational response.
Fig 27
Fig 27. Pau de Fruta peat bog.
Upper graph showing one of the factor scores from the PCA of geochemical analysis (GC2) which is related to the input of regional dust (modified from Horák-Terra et al. 2015). Negative scores indicate low contribution of regional dust. Note the sharp peak marking the 8.2 ka event and the overall good match between higher scores (probably related to rhesistatic conditions) and gaps in the archaeological signal.
Fig 28
Fig 28
Summed probability distribution graphs for A) São Paulo; B) Paraná; C) Santa Catarina; D) Rio Grande do Sul.
Fig 29
Fig 29. Botuverá cave BTV2 speleothem data for the last 15,000 years.
Mean CVs averaged at 120 yr intervals for delta 13C (proxy for vegetation). Dashed line shows the value of the mean plus one standard deviation for the CV. The largest peaks of variability occur at 3.0, 3.7, 5.2, and 8.2ka BP.
Fig 30
Fig 30. Botuverá cave BTV2 speleothem data for the last 15 ka.
Mean CVs averaged at 120 yr intervals for delta 18O (proxy for precipitation). Dashed line shows the value of the mean plus one standard deviation for the CV. The largest peaks of variability occurr at 3.6, 7.5. and 8.2 ka BP.
Fig 31
Fig 31. Summed probability distribution graphs for Paraná and Santa Catarina.
The arrows mark events of high climatic variability calculated for Botuverá cave BTV2 speleothem. Grey arrows mark the 13C (proxy for vegetation) and black arrows the 18O (proxy for precipitation).
Fig 32
Fig 32
Summed probability distribution graphs for the Southern Brazil coastal areas, from North do South: A) Espirito Santo (ES) and Rio de Janeiro (RJ); B) São Paulo (SP) and Paraná (PR); C) Santa Catarina (SC) and Rio Grande do Sul (RS).
Fig 33
Fig 33. Aspect of the Southern Brazil coastal area showing the major differences in the geomorphology of the continental shelf.
The black bars perpendicular to the coast represent bathymetric transects whose profiles are shown on the right. Given the same amount of sea level rise, the territorial loss would be much larger in the SP/PR coast than in the other regions.
Fig 34
Fig 34. Summed probability distribution graphs for all coastal sites.
Grey bars show the 1) a sharp depression in ages ca. 4 ka BP; 2) a pronounced valley around 3 ka BP; 3) another sharp decrease ca. 1.3 ka BP.

References

    1. Watanabe O, Jouzel J, Johnsen S, Parrenin F, Shoji H, Yoshida N. Homogeneous climate variability across East Antarctica over the past three glacial cycles. Nature. 2003;422(6931):509–12. 10.1038/nature01525. - DOI - PubMed
    1. North Greenland Ice Core Project members. High-resolution record of Northern Hemisphere climate extending into the last interglacial period. Nature. 2004;431(7005):147–51. 10.1038/nature02805. - DOI - PubMed
    1. Burroughs WJ. Climate Change in Prehistory ‐ The End of the Age of Chaos. Cambridge: Cambridge University Press; 2005.
    1. Barton CM, Schmich S, James SR. The ecology of human colonization in pristine landscapes. In: Barton CM, Clark GA, Yesner DR, Pearson GA, editors. The settlement of the American continents: A multidisciplinary approach to human biogeography. Tucson, AZ: University of Arizona Press; 2004. pp.138-61.
    1. Richerson PJ, Boyd R, Bettinger RL. Was Agriculture Impossible during the Pleistocene but Mandatory during the Holocene? A Climate Change Hypothesis. Am Antiq. 2001;66(3):387–411. 10.2307/2694241. - DOI

Publication types